2026 Biotech HF Positioning —— Q2
What twenty-five biotech-focused and general funds did in the second quarter of 2026 — and, for the first time, how that compares with what they did the quarter before.
The Q1 brief was a snapshot. With a second quarter of data, the more useful question changes from “what do these funds own?” to “what are they still doing?” This brief repeats the Q1 views on Q2 filings, then adds three quarter-over-quarter charts that track whether positioning persisted, reversed, or disappeared — and checks how the patterns flagged last quarter actually played out.
The LandscapeOverview whole quarter
As in Q1, the starting point is the fund-by-ticker signal map for the twenty-five most widely held names. Greens are positions being built (Added or New), reds are positions being reduced or exited (Trimmed or Exited), and gray means the fund doesn’t hold the name.
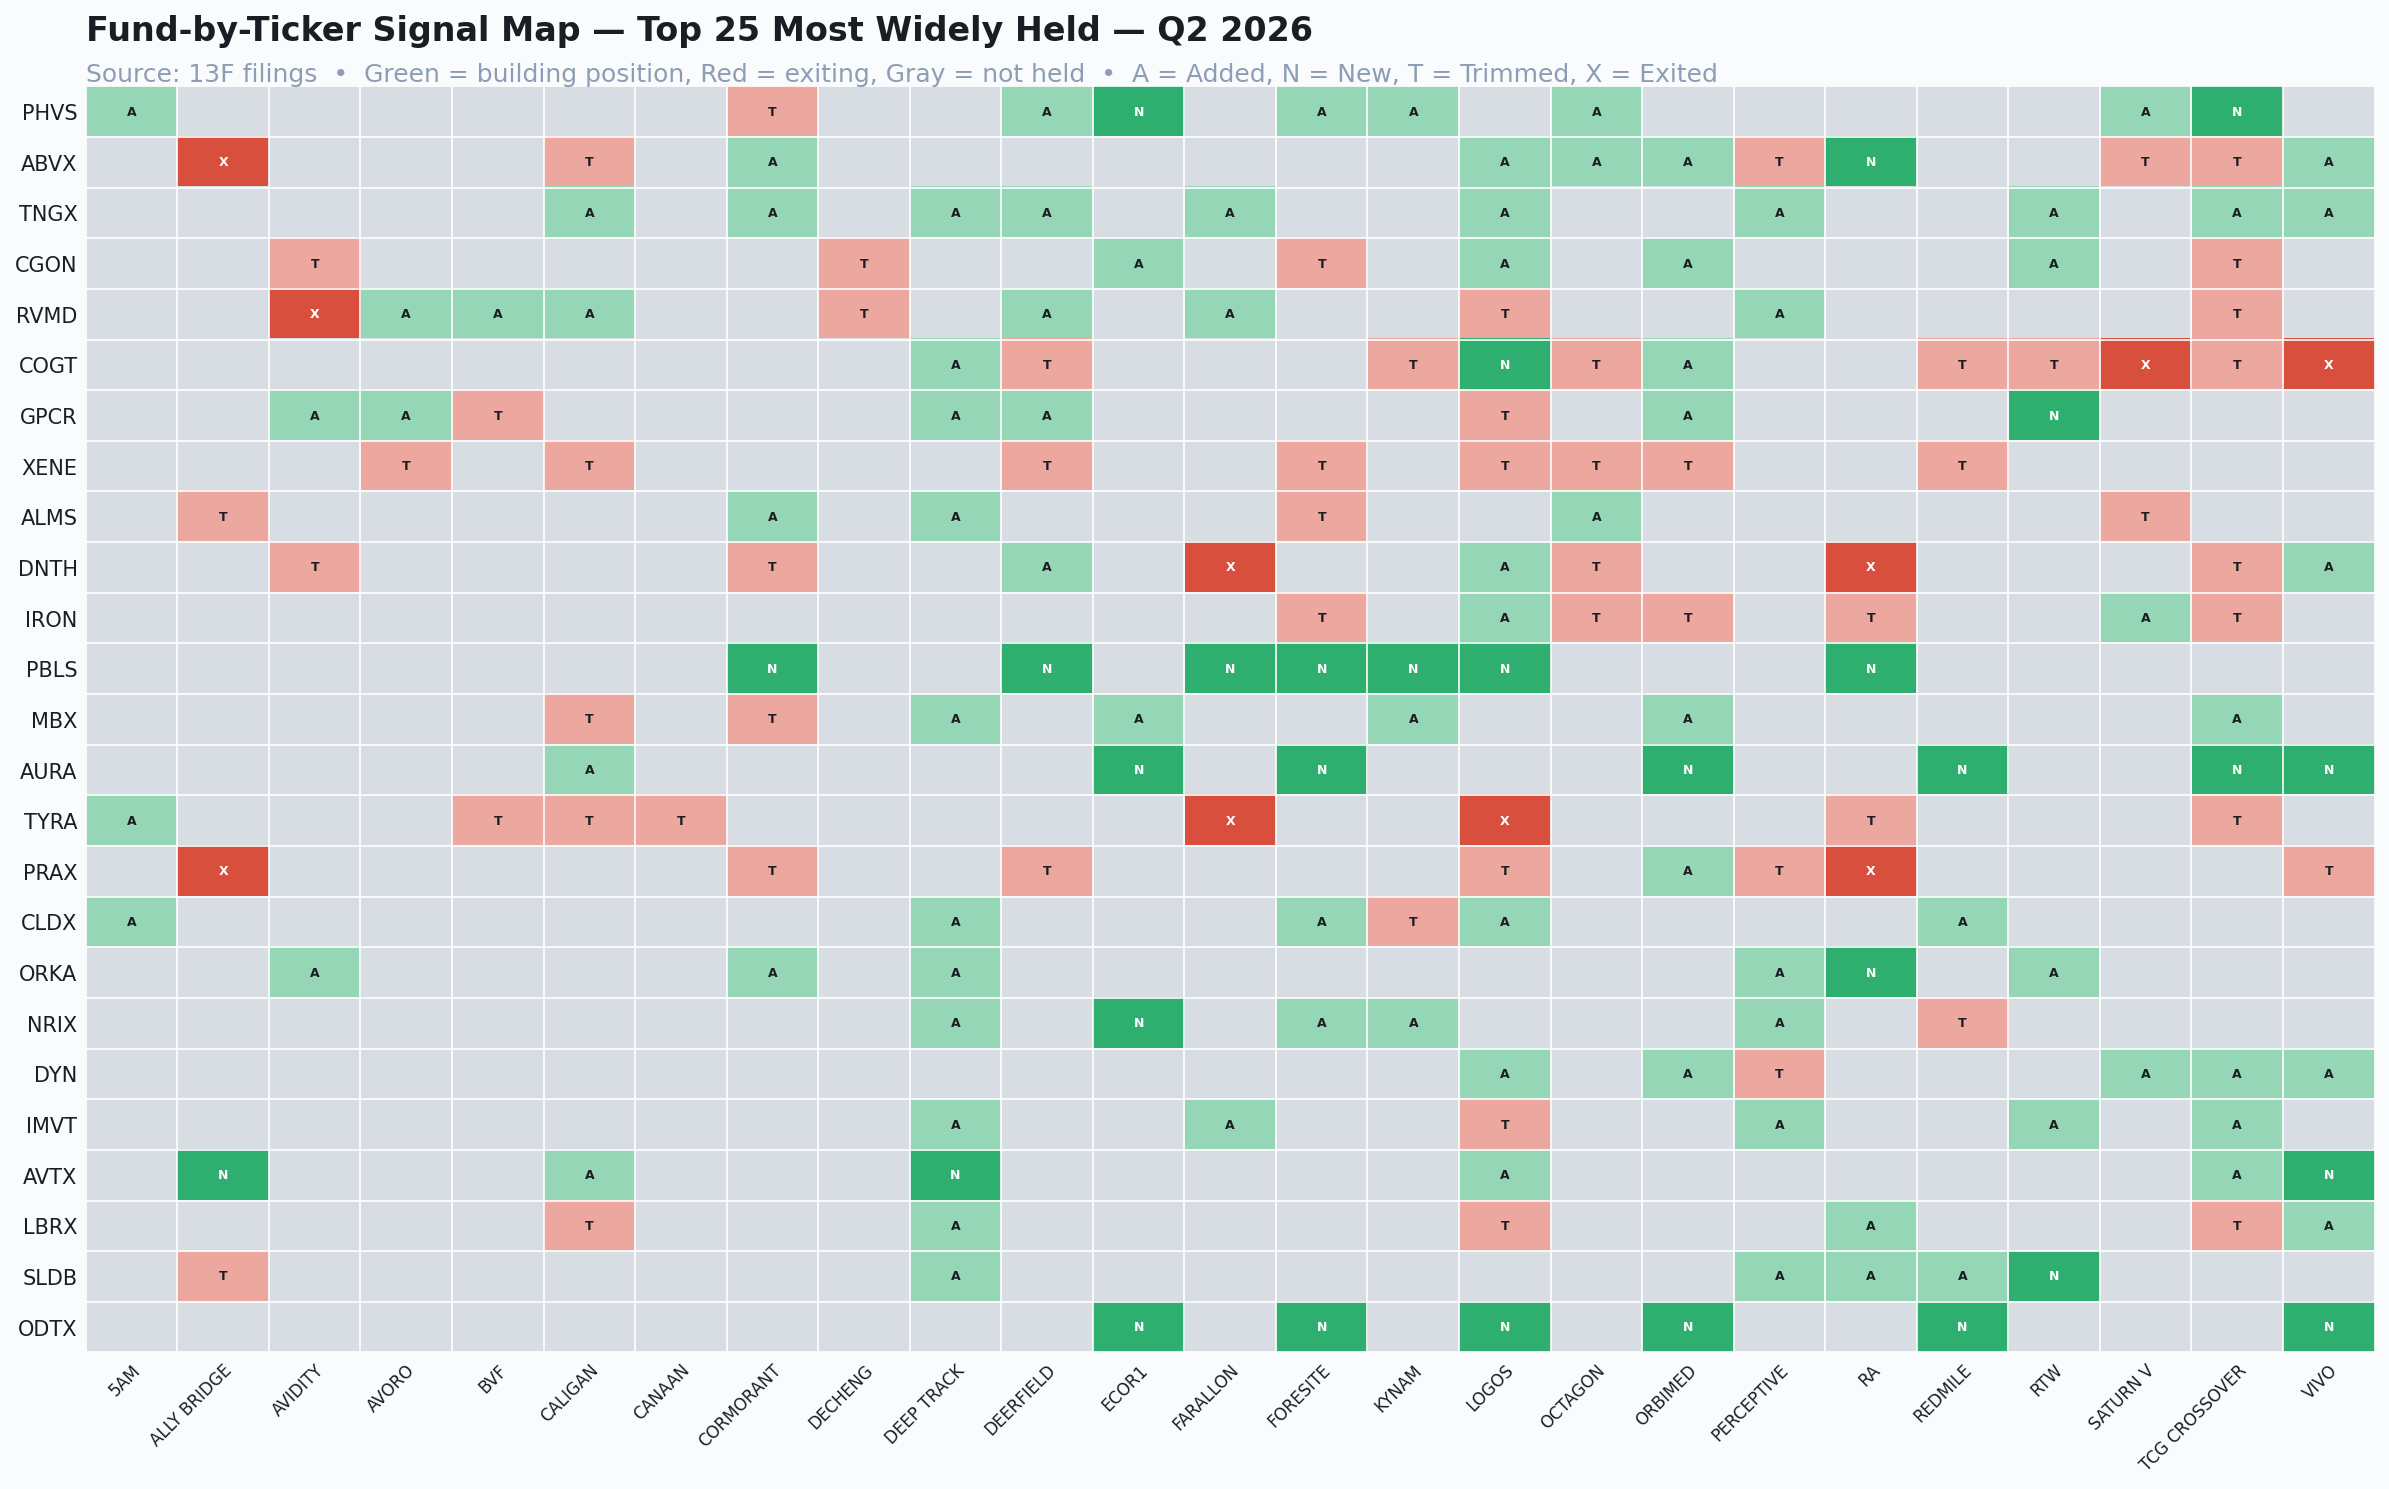
Each row is a ticker; each column is a fund. Green cells indicate the fund added to or initiated the position this quarter; red cells indicate trimming or full exit; gray indicates no holding.
Reading across rows, two names are unusually one-directional. PBLS (Parabilis Medicines) is solid dark green: every one of its seven holders opened the position this quarter. That’s less dramatic than it looks — Parabilis only began trading on June 10, so every holder is “new” by definition. The row records an IPO, not seven funds changing their minds. XENE is the opposite — all eight holders trimmed and none added, the cleanest “held broadly, reduced broadly” row on the map. It echoes ABVX in Q1: nobody has left, but no one is adding either.
ODTX (Odyssey Therapeutics, listed in May) shows the same IPO pattern. AURA (Aura Biosciences) is the more interesting cluster of dark-green initiations, because it was already a listed company. The rest of the map is more mixed than it was in Q1. That mix is the first hint of the quarter’s main theme: a lot of positioning changed direction.
ConsensusThe most widely held names
The Q1 leader, Centessa (CNTA), is gone from the list entirely — not because funds lost conviction, but because Eli Lilly acquired it (more on that below). The top slot is now a three-way tie at ten funds: Pharvaris (PHVS), Abivax (ABVX), and Tango (TNGX), followed by CGON, RVMD, and COGT at nine.
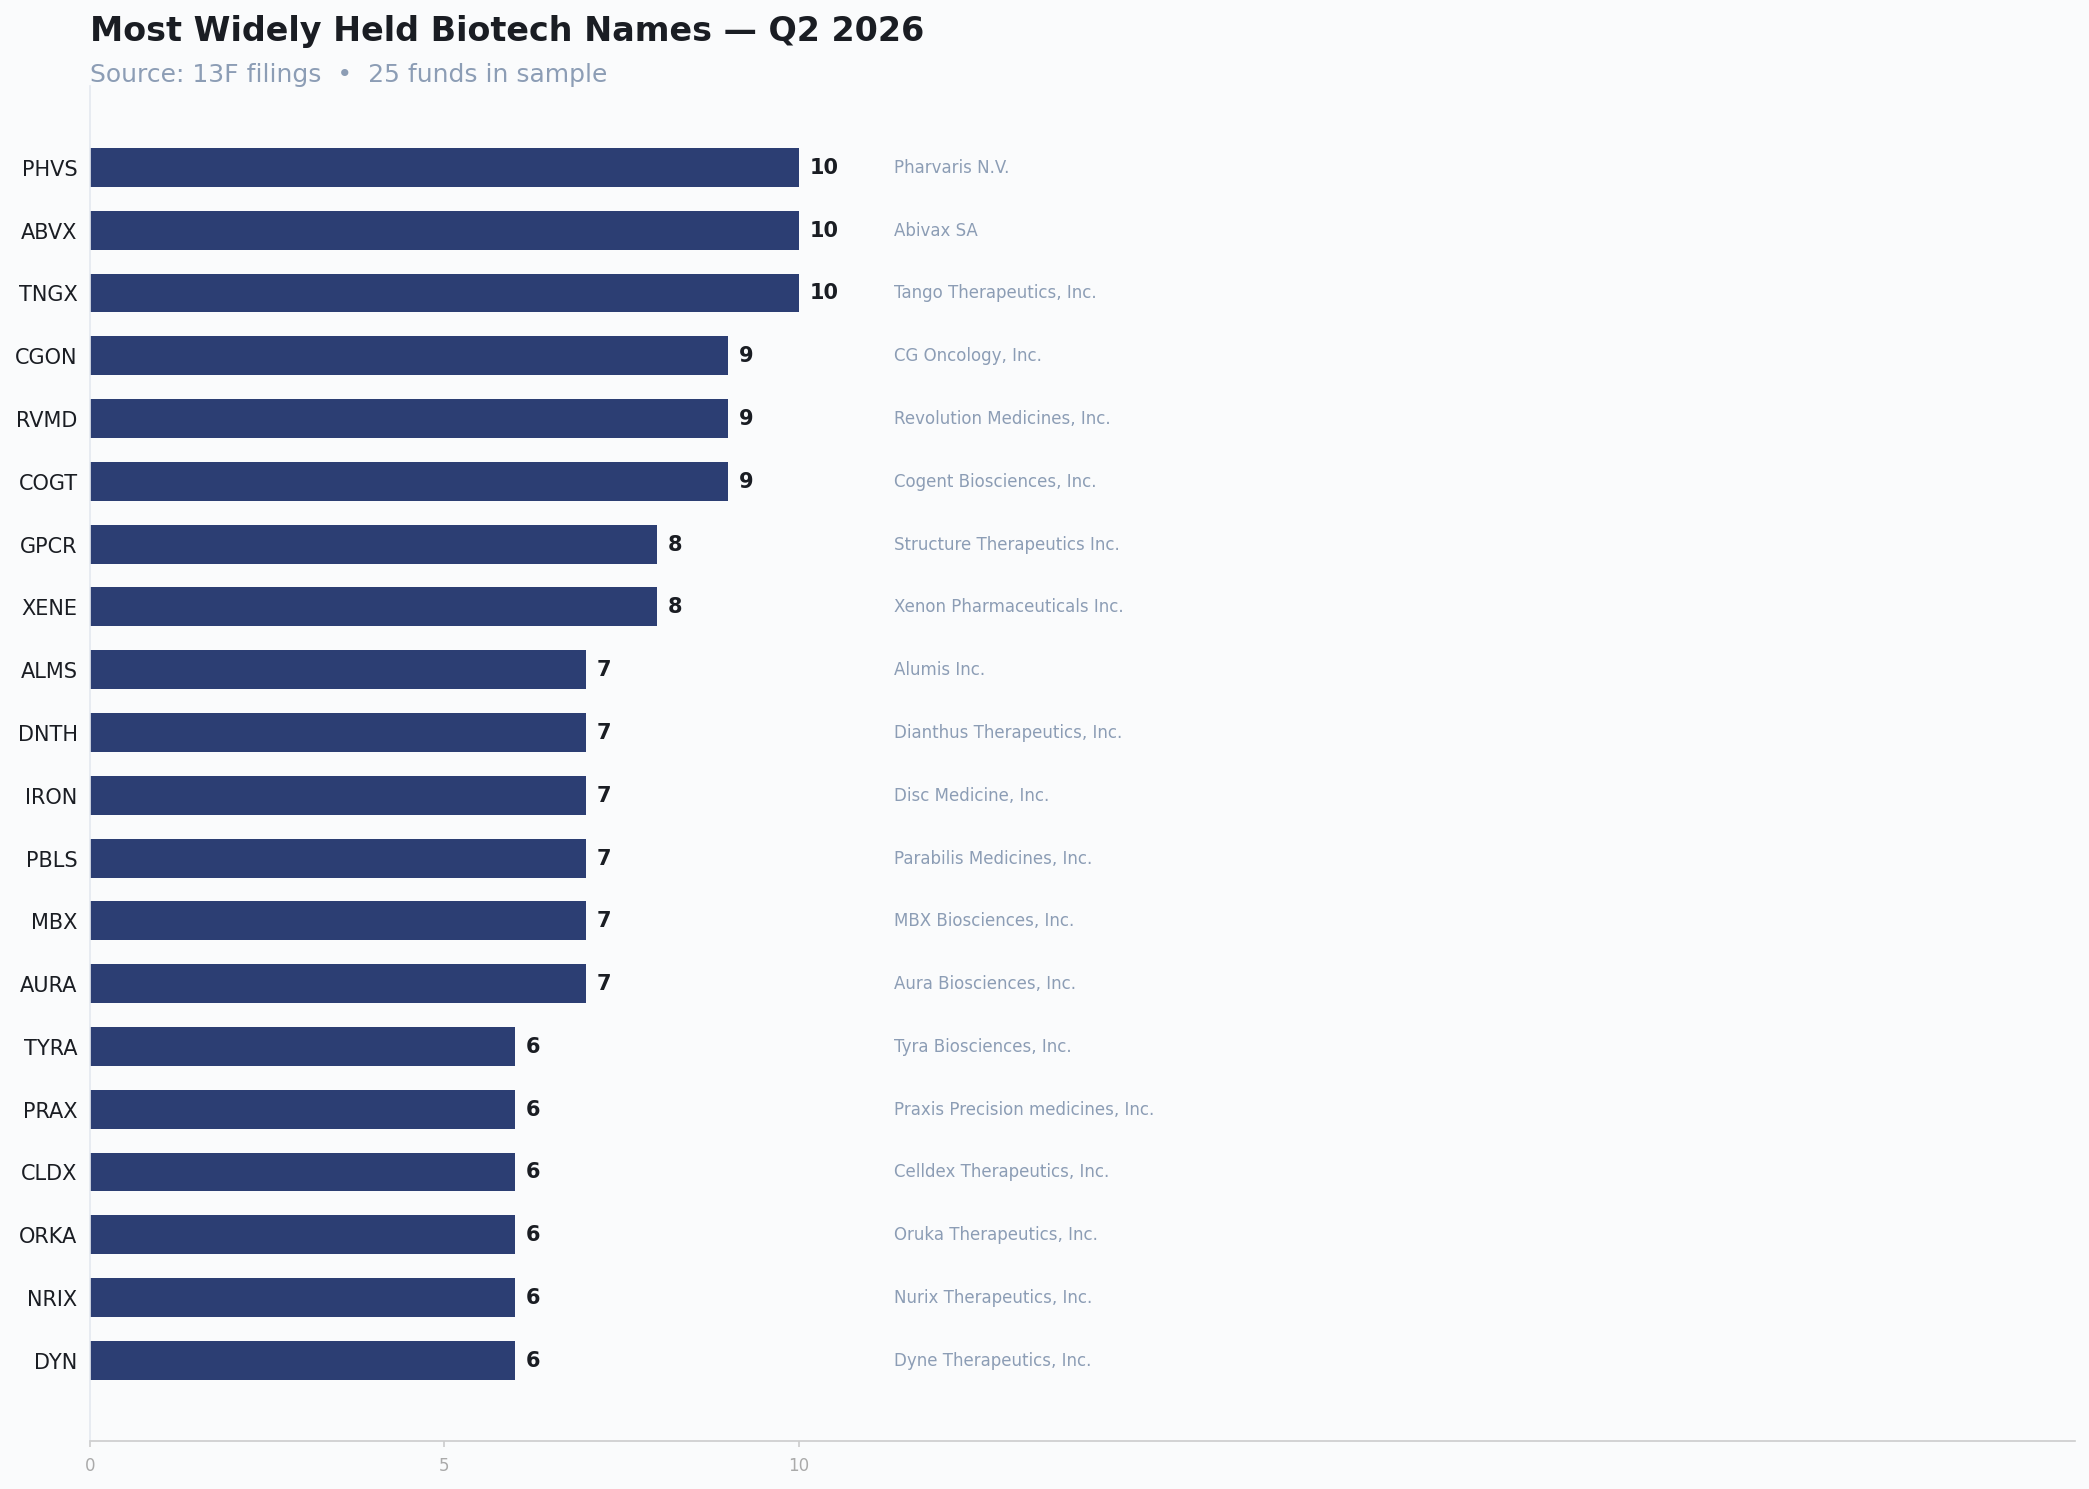
Number of funds (out of 25) holding each ticker. PHVS, ABVX, and TNGX lead at 10; CGON, RVMD, and COGT follow at 9.
ABVX is the interesting survivor. In Q1 it was the reddest row on the signal map, trimmed broadly by eleven holders. In Q2 it is still held by ten funds, and its dominant action flipped from trimming to adding — a reminder that one quarter of broad trimming is not a verdict.
ConvictionBreadth versus concentration
The same breadth-versus-weight view as last quarter: number of funds holding a name (horizontal) against the average position size among those holders (vertical).
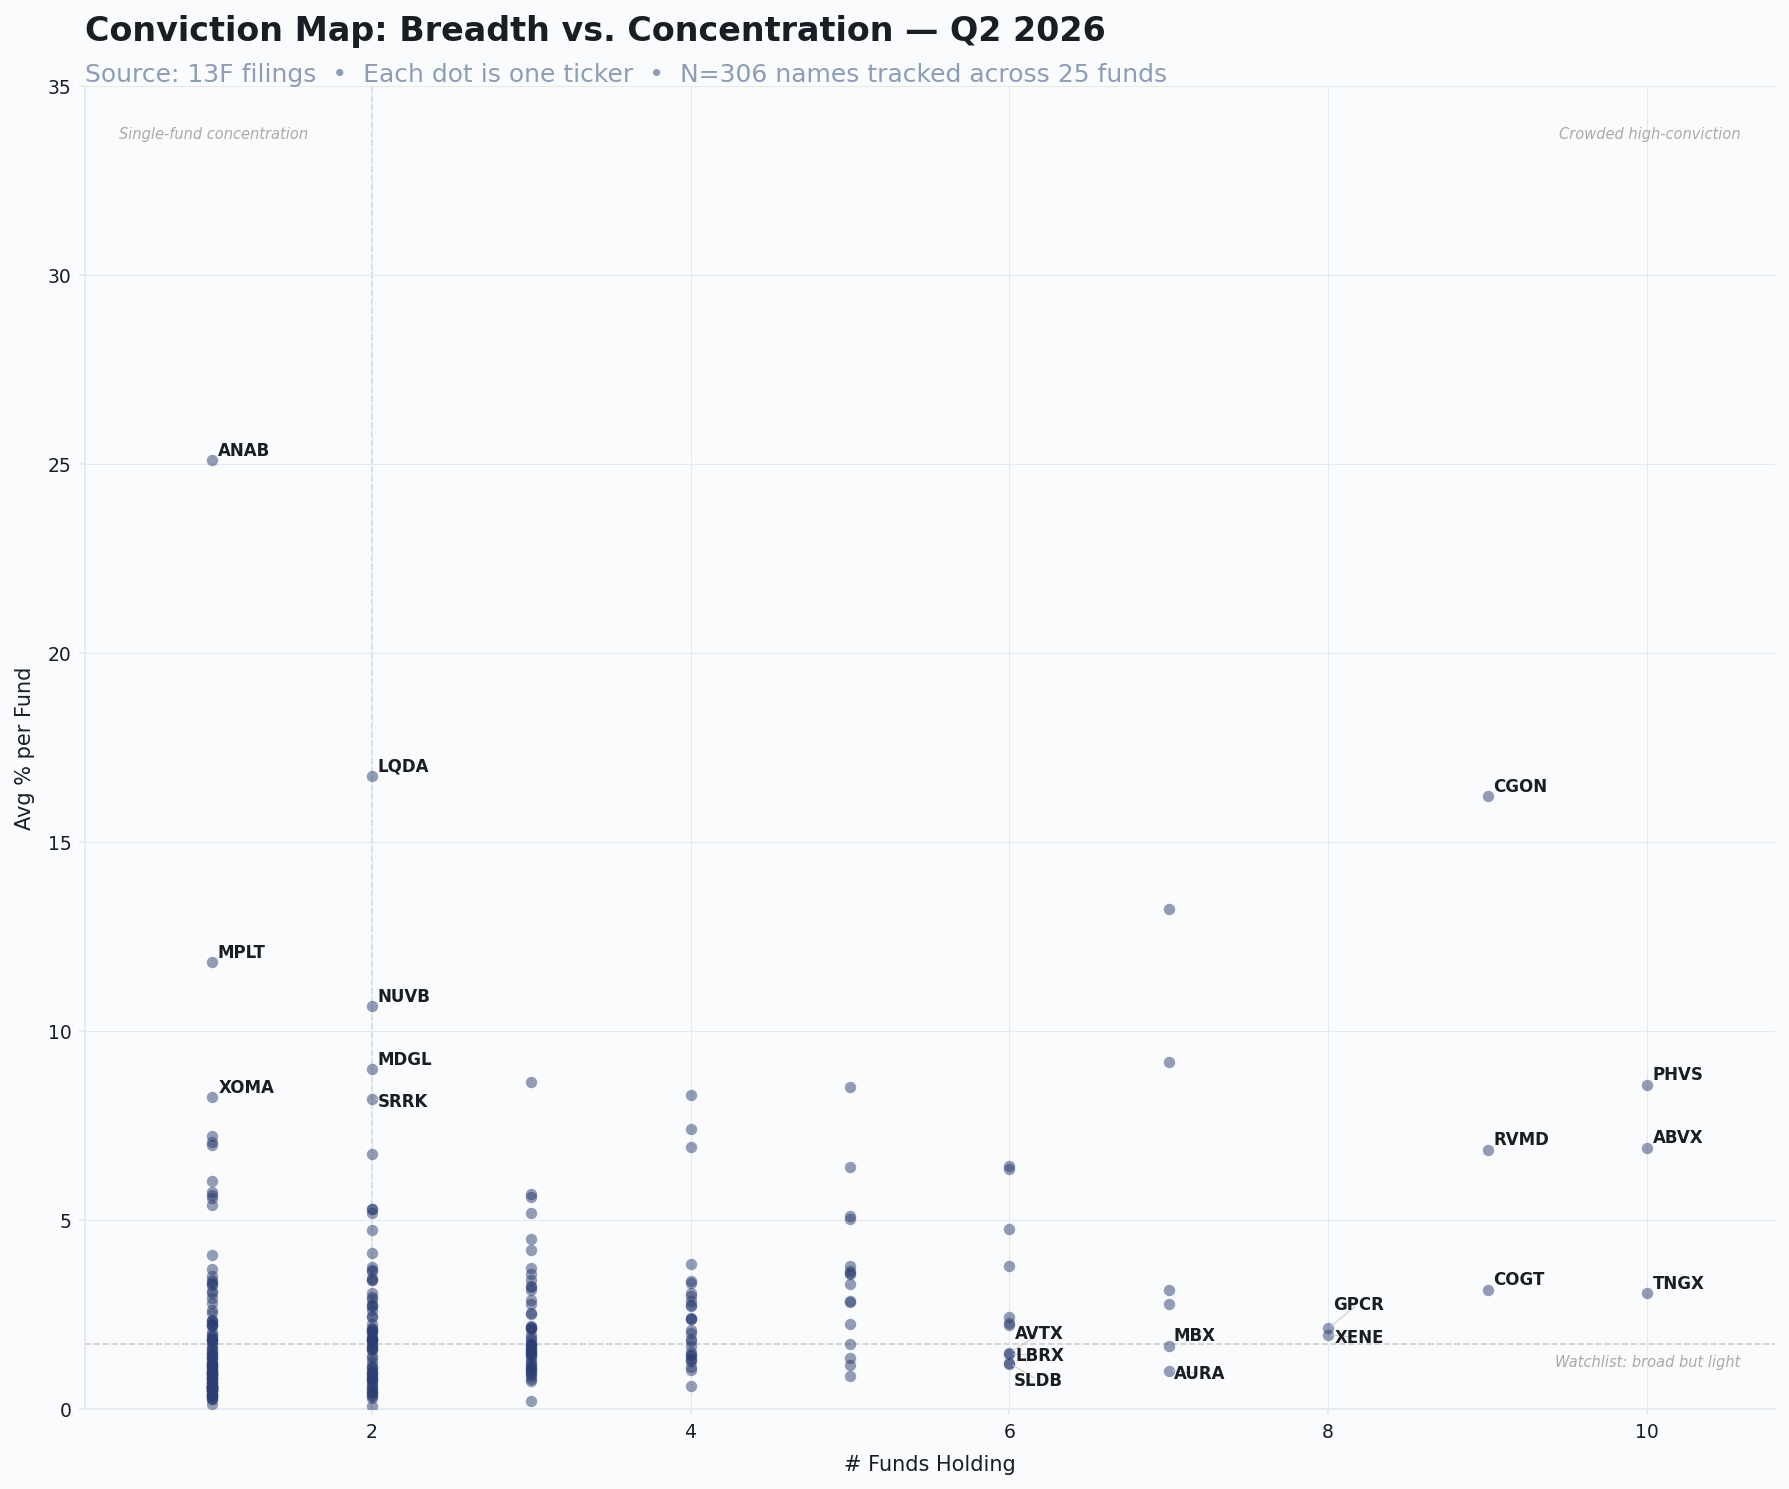
Each dot is one ticker; 306 names tracked across 25 funds. Top-right would indicate crowded high conviction; top-left, single-fund concentration; bottom-right, broad but light holdings.
The top-right corner is still nearly empty. CGON remains the only name that is both widely held (nine funds) and heavily weighted (around 16% on average). The names tied for most widely held — PHVS, ABVX, TNGX — all sit well below 10% average weight: consensus, but sized as consensus rather than as a thesis.
The top-left corner changed. In Q1, SRRK sat almost alone as a single-fund bet worth roughly 30% of one book. This quarter Redmile cut that position sharply, and SRRK drops to a two-fund name at around 8%. ANAB now occupies that corner at roughly 25% of a single fund’s portfolio. Single-fund conviction is a real signal, but SRRK is a good example of how quickly it can unwind — and why one quarter of it is not enough to call it a trend.
ShiftsThe largest moves of the quarter
Aggregate quarter-over-quarter change across the twenty-five funds, with stacked segments showing whether a move came from many funds nudging a position or one fund moving a lot.
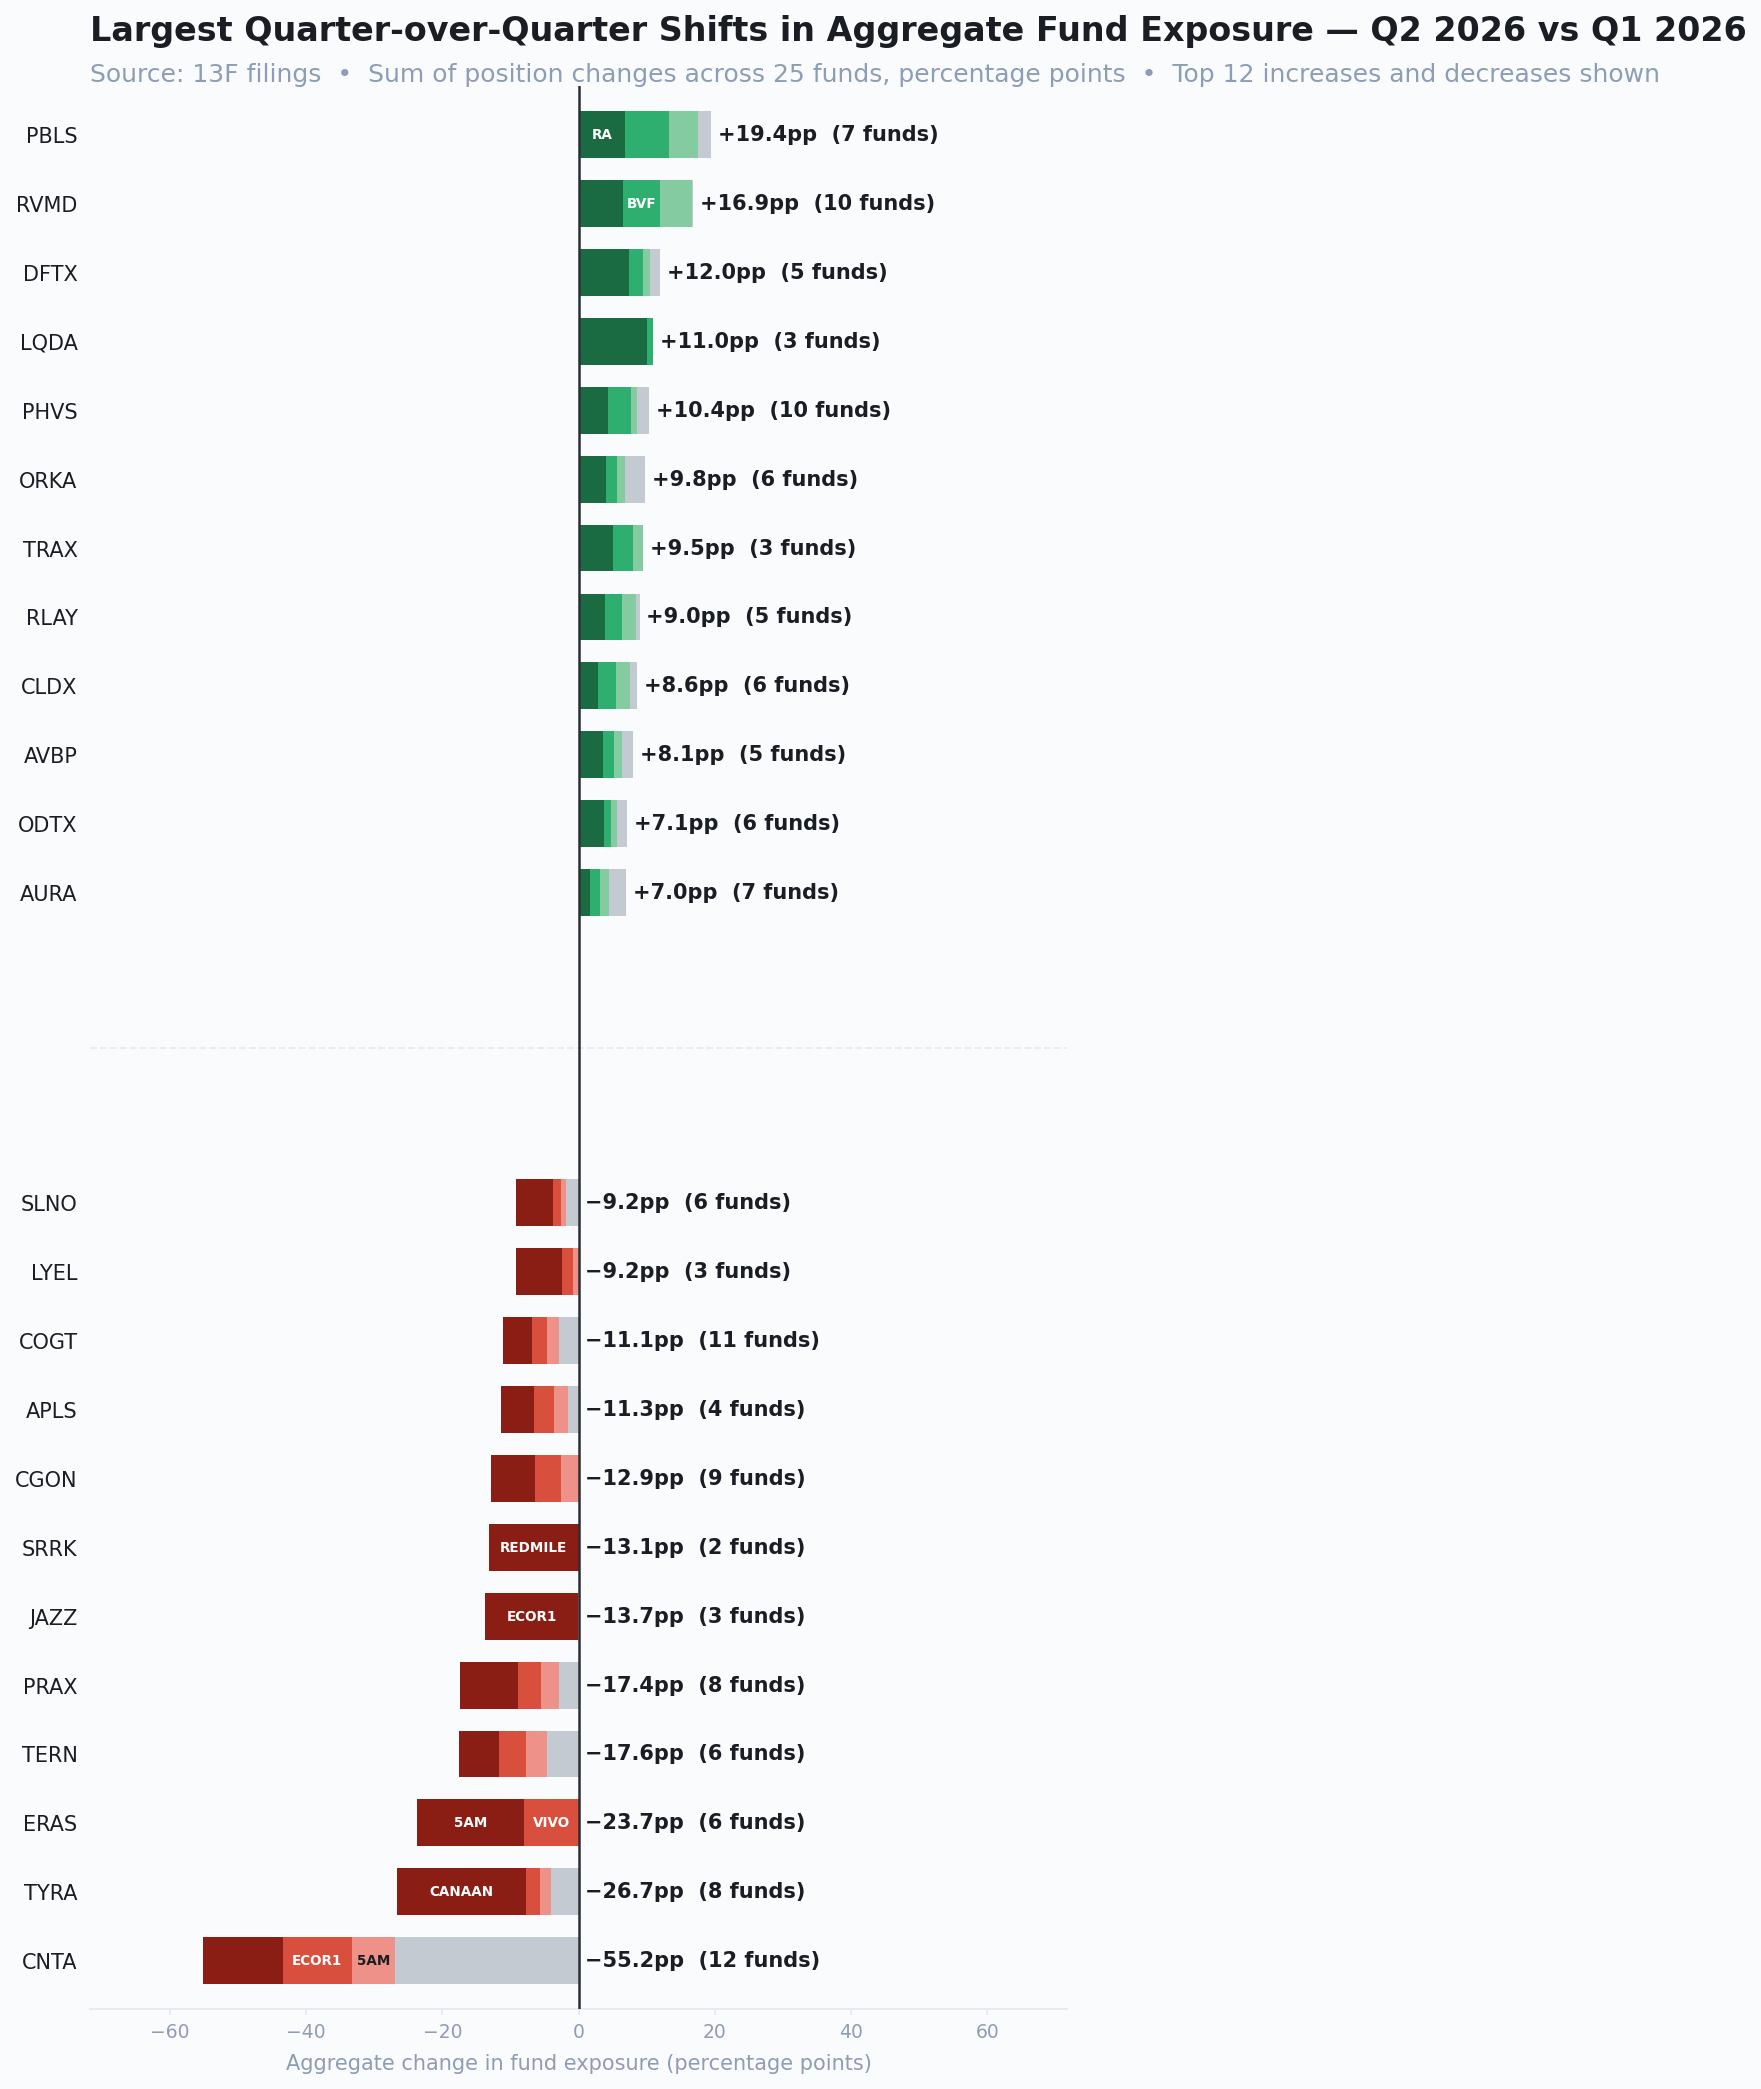
Sum of position changes across 25 funds, in percentage points. Top twelve increases and decreases shown. Stacked color segments indicate contribution from individual funds.
On the buy side, PBLS leads at +19.4pp across seven funds — all of it from positions created by its June IPO. RVMD (+16.9pp, ten funds) is the steadier story: an already widely held name that funds kept building. LQDA (+11.0pp) is the concentrated counterexample, with most of the move coming from a single fund across only three holders.
Definium (DFTX) at +12.0pp across five funds is worth a note. The company reported positive Phase 3 data on June 22 and closed an upsized equity offering days later, both before quarter-end. Some of this increase likely reflects funds participating in that raise rather than buying in the open market — 13F data can’t distinguish the two, but the timing makes it the more likely reading.
On the reduction side, CNTA’s −55.2pp across twelve funds is mechanical: Eli Lilly completed its acquisition of Centessa on June 24, so every holder was cashed out before quarter-end. The discretionary reductions are TYRA (−26.7pp, eight funds) and ERAS (−23.7pp, six funds) — but both are dominated by one or two funds (Canaan for TYRA; 5AM and Vivo for ERAS), so they say more about those books than about the sector.
InitiationsCoordinated new positions — and the IPO effect
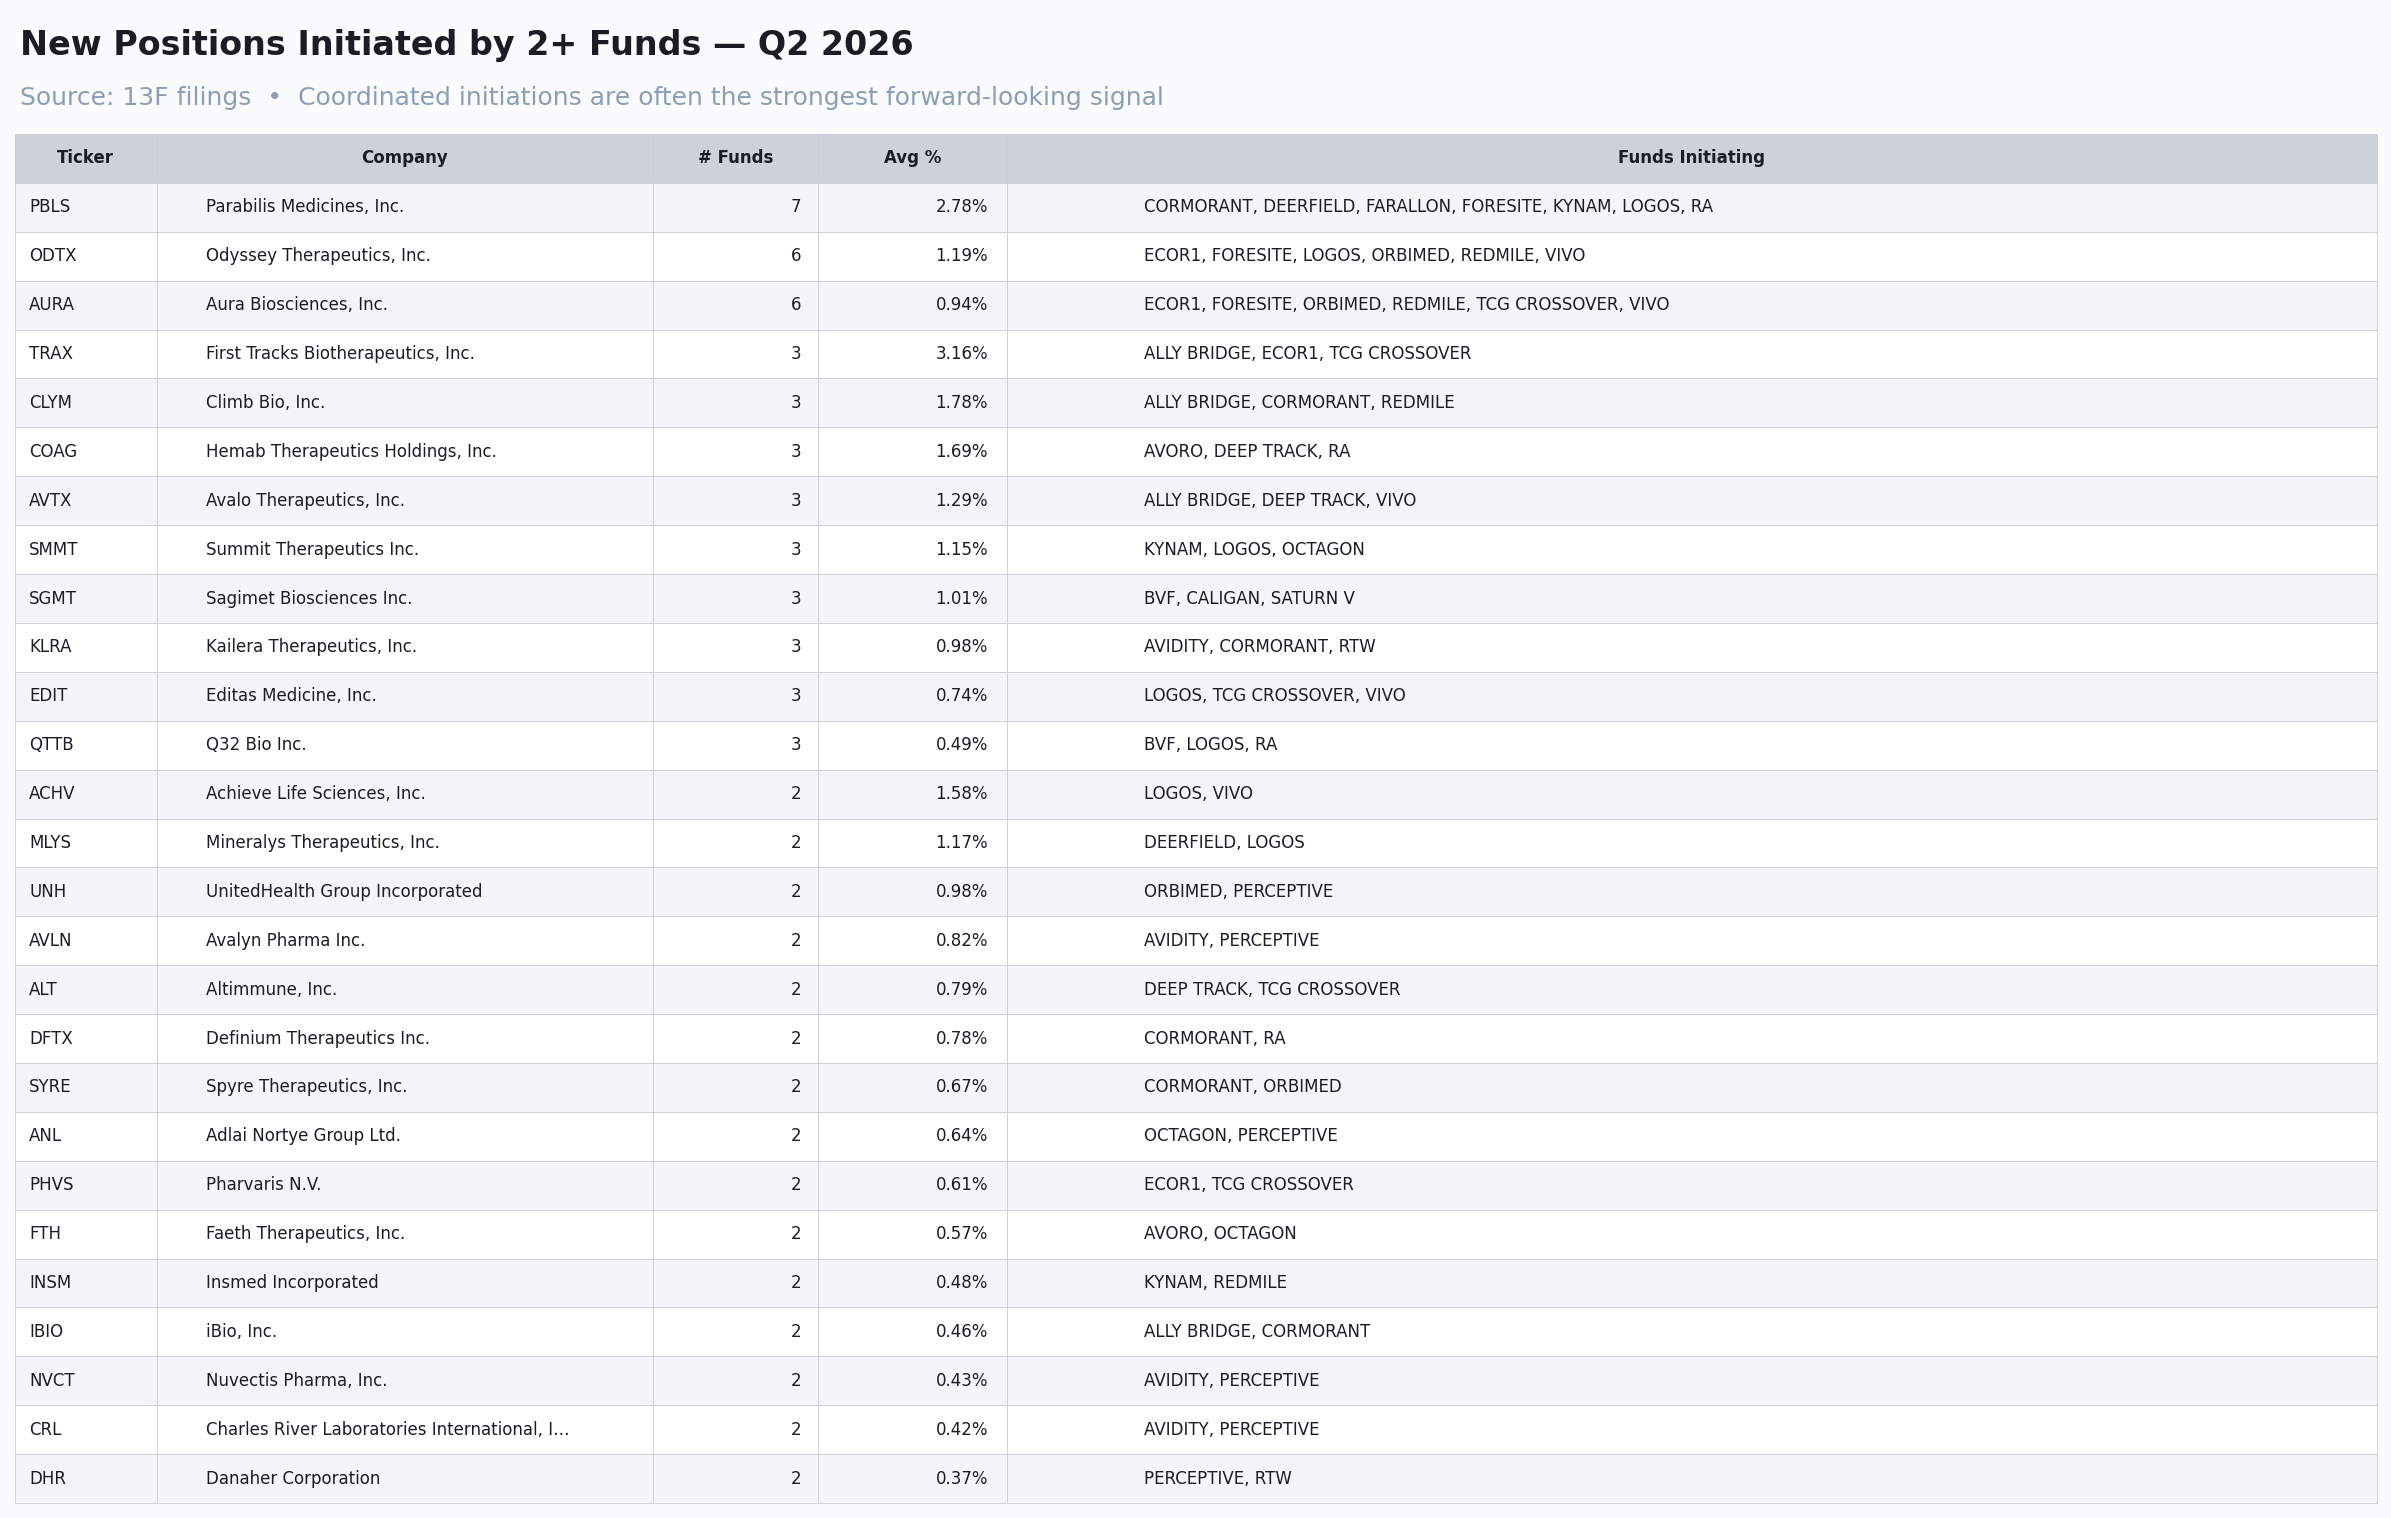
Names where two or more funds opened a new position in Q2 2026, ranked by number of initiating funds. Several of the top names listed on Nasdaq during the quarter.
At first glance the coordinated-initiation signal looks much stronger than in Q1: PBLS at seven funds, ODTX and AURA at six. But most of the top of this table is companies that went public during Q2 — Parabilis (PBLS) in June, Odyssey (ODTX) in May, plus Kailera (KLRA), Hemab (COAG), and Avalyn (AVLN) — and First Tracks (TRAX) is a spinoff from AnaptysBio, so some of its holders received shares rather than bought them.
That matters because crossover funds often invest in a company before it lists. When it IPOs, the private stake becomes a listed position and appears in the 13F as “New” — RA Capital, for example, was a principal pre-IPO shareholder of Parabilis, and Foresite and OrbiMed backed Odyssey privately. In the Q1 brief I noted that private holdings are invisible in 13F data; this is the other side of that coin, the moment they become visible. Buying into an IPO is still a real decision, but a pre-IPO stake converting into public shares is not a new one, and 13F data can’t tell the two apart.
Setting the IPOs and the spinoff aside, the strongest coordinated initiation in an already-listed company is AURA at six funds, followed by a group at three (including SMMT, SGMT, AVTX, and EDIT). That is a more modest signal than the headline table suggests — and a lesson I’ll carry forward: check listing dates before reading “New” as conviction.
ExitsNames every prior holder abandoned
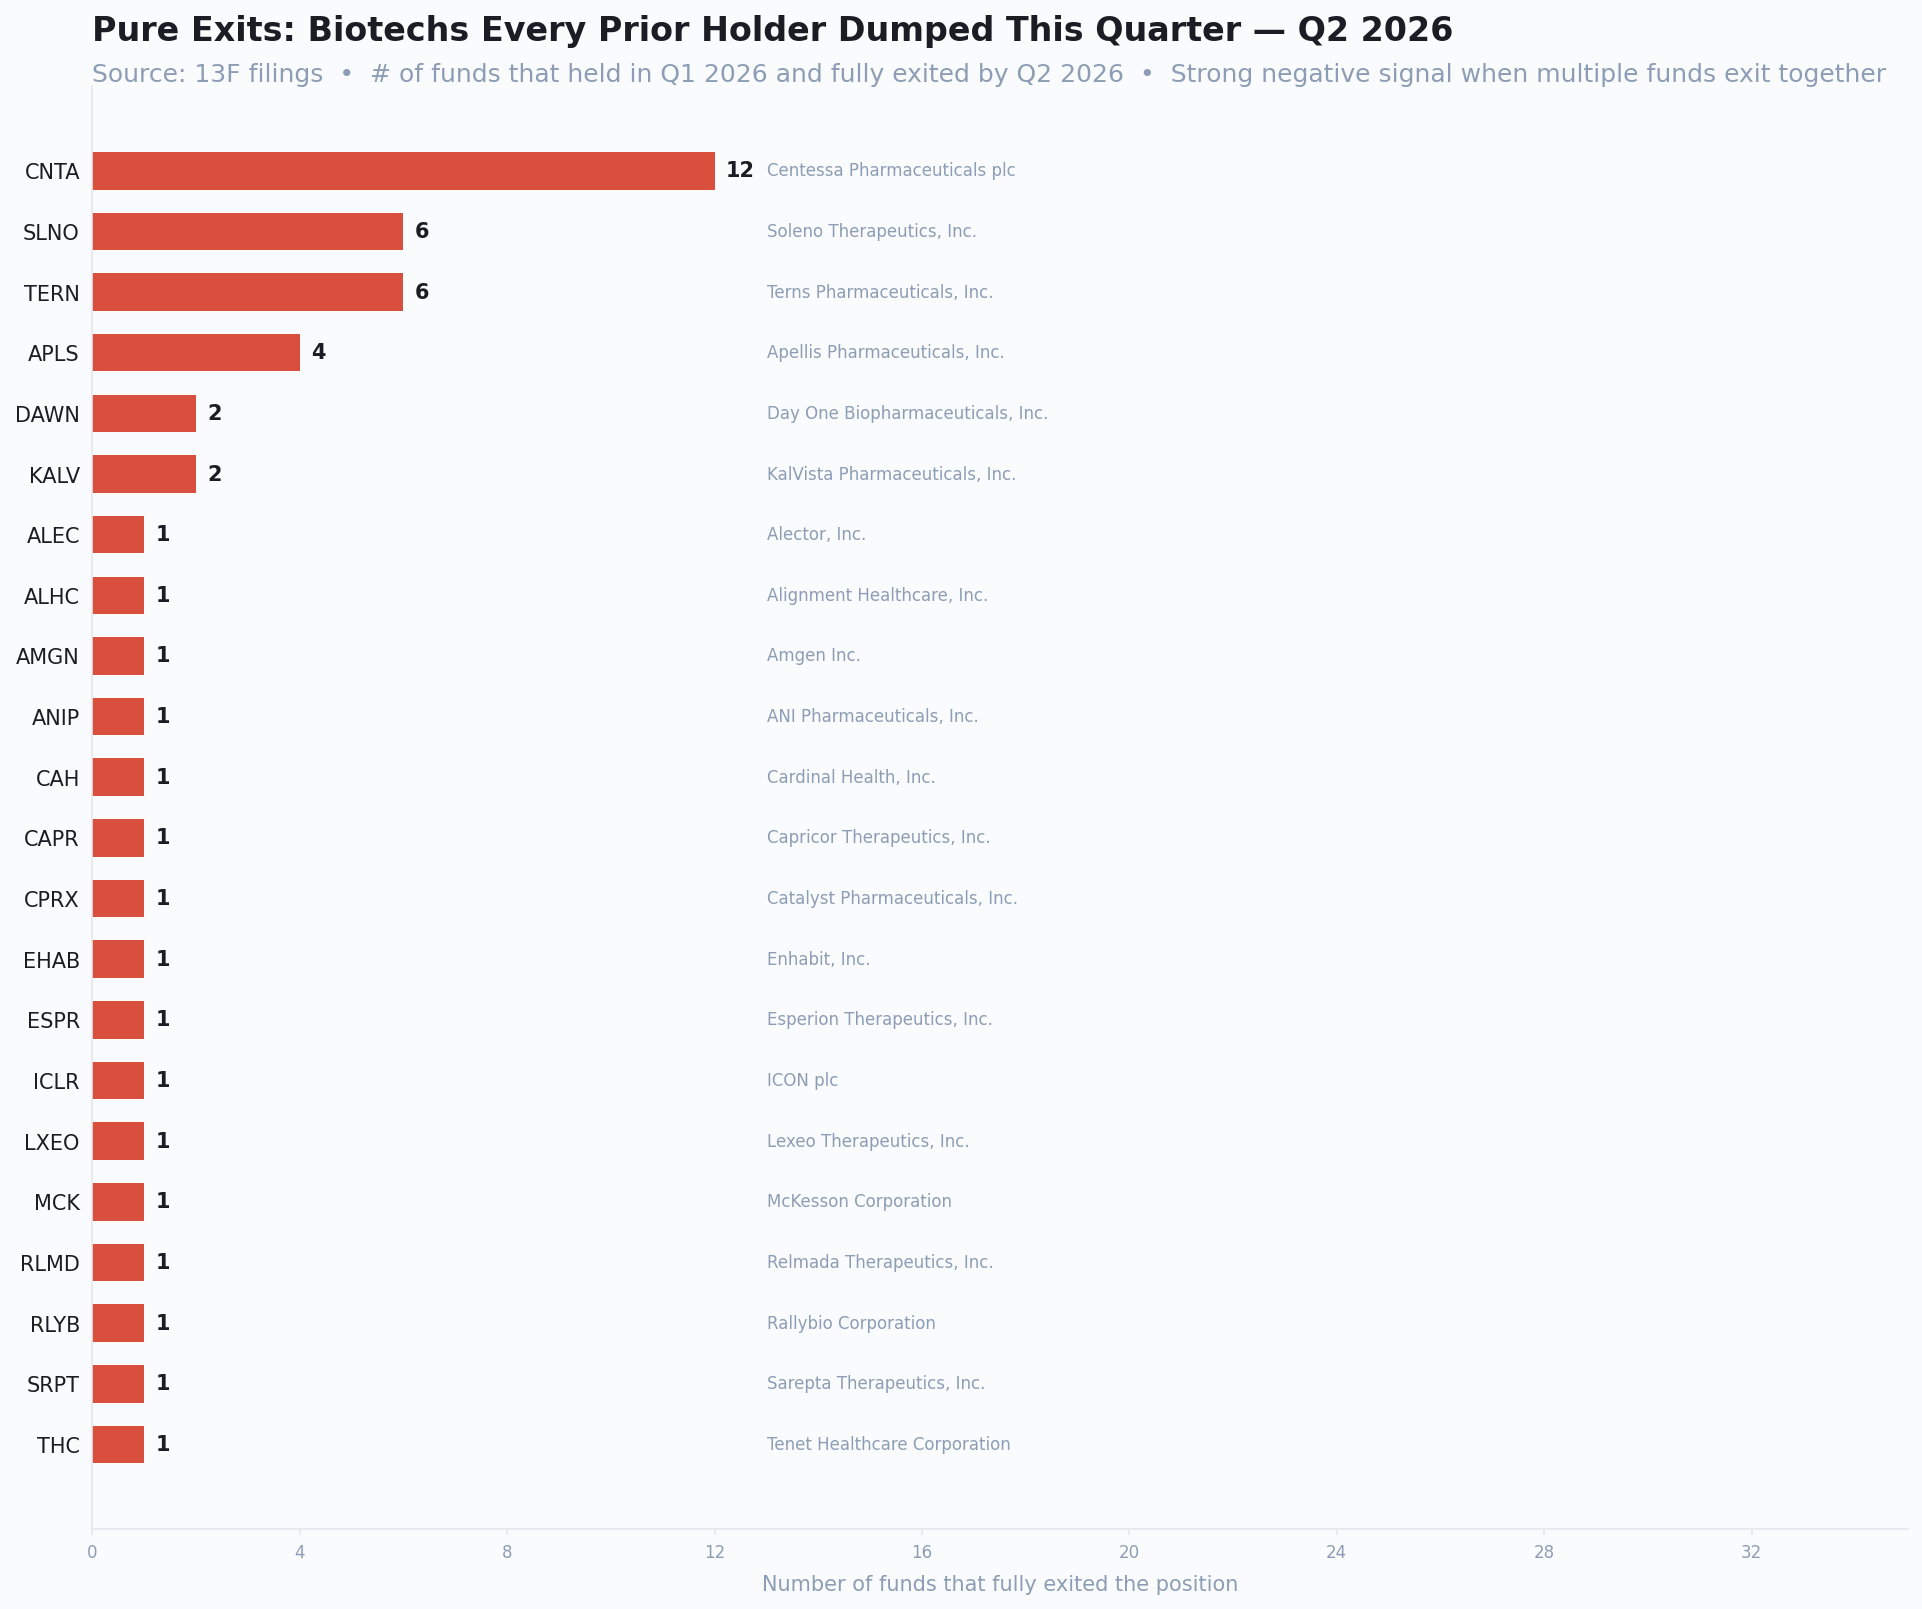
Number of funds that held the position in Q1 2026 and fully exited by Q2 2026. The top three — CNTA, SLNO, and TERN — were all acquired.
On its face this chart shows funds dumping names. For the top three it shows something else: each company was bought.
Centessa (CNTA), twelve funds. Eli Lilly agreed to acquire Centessa on March 31 for $38 per share in cash plus a contingent value right worth up to $9 more, and completed the deal on June 24. The stock was delisted before quarter-end, so all twelve holders were cashed out — none of them chose to sell.
Terns (TERN), six funds. Merck acquired Terns for $53 per share in cash; the deal closed on May 5.
Soleno (SLNO), six funds. Neurocrine agreed on April 6 to acquire Soleno for $53 per share in cash, with holders tendering or selling into the deal.
This is the same caveat as RAPT and CDTX in Q1, only larger: a takeover produces a full exit with no loss of conviction behind it. It also turns this chart into a scorecard of sorts. CNTA was the most uniformly green row in the Q1 signal map, held by thirteen funds; one quarter later it was bought at a large premium. Broad, supported consensus isn’t always “being late” — sometimes it’s being right. Below the top three, the exits are small (four funds or fewer) and the reasons aren’t visible in the data.
Quarter over quarterWhat persisted, and what reversed
The three charts below only exist because there are now two quarters of data. The first classifies every ticker by its dominant action in Q1 and again in Q2.
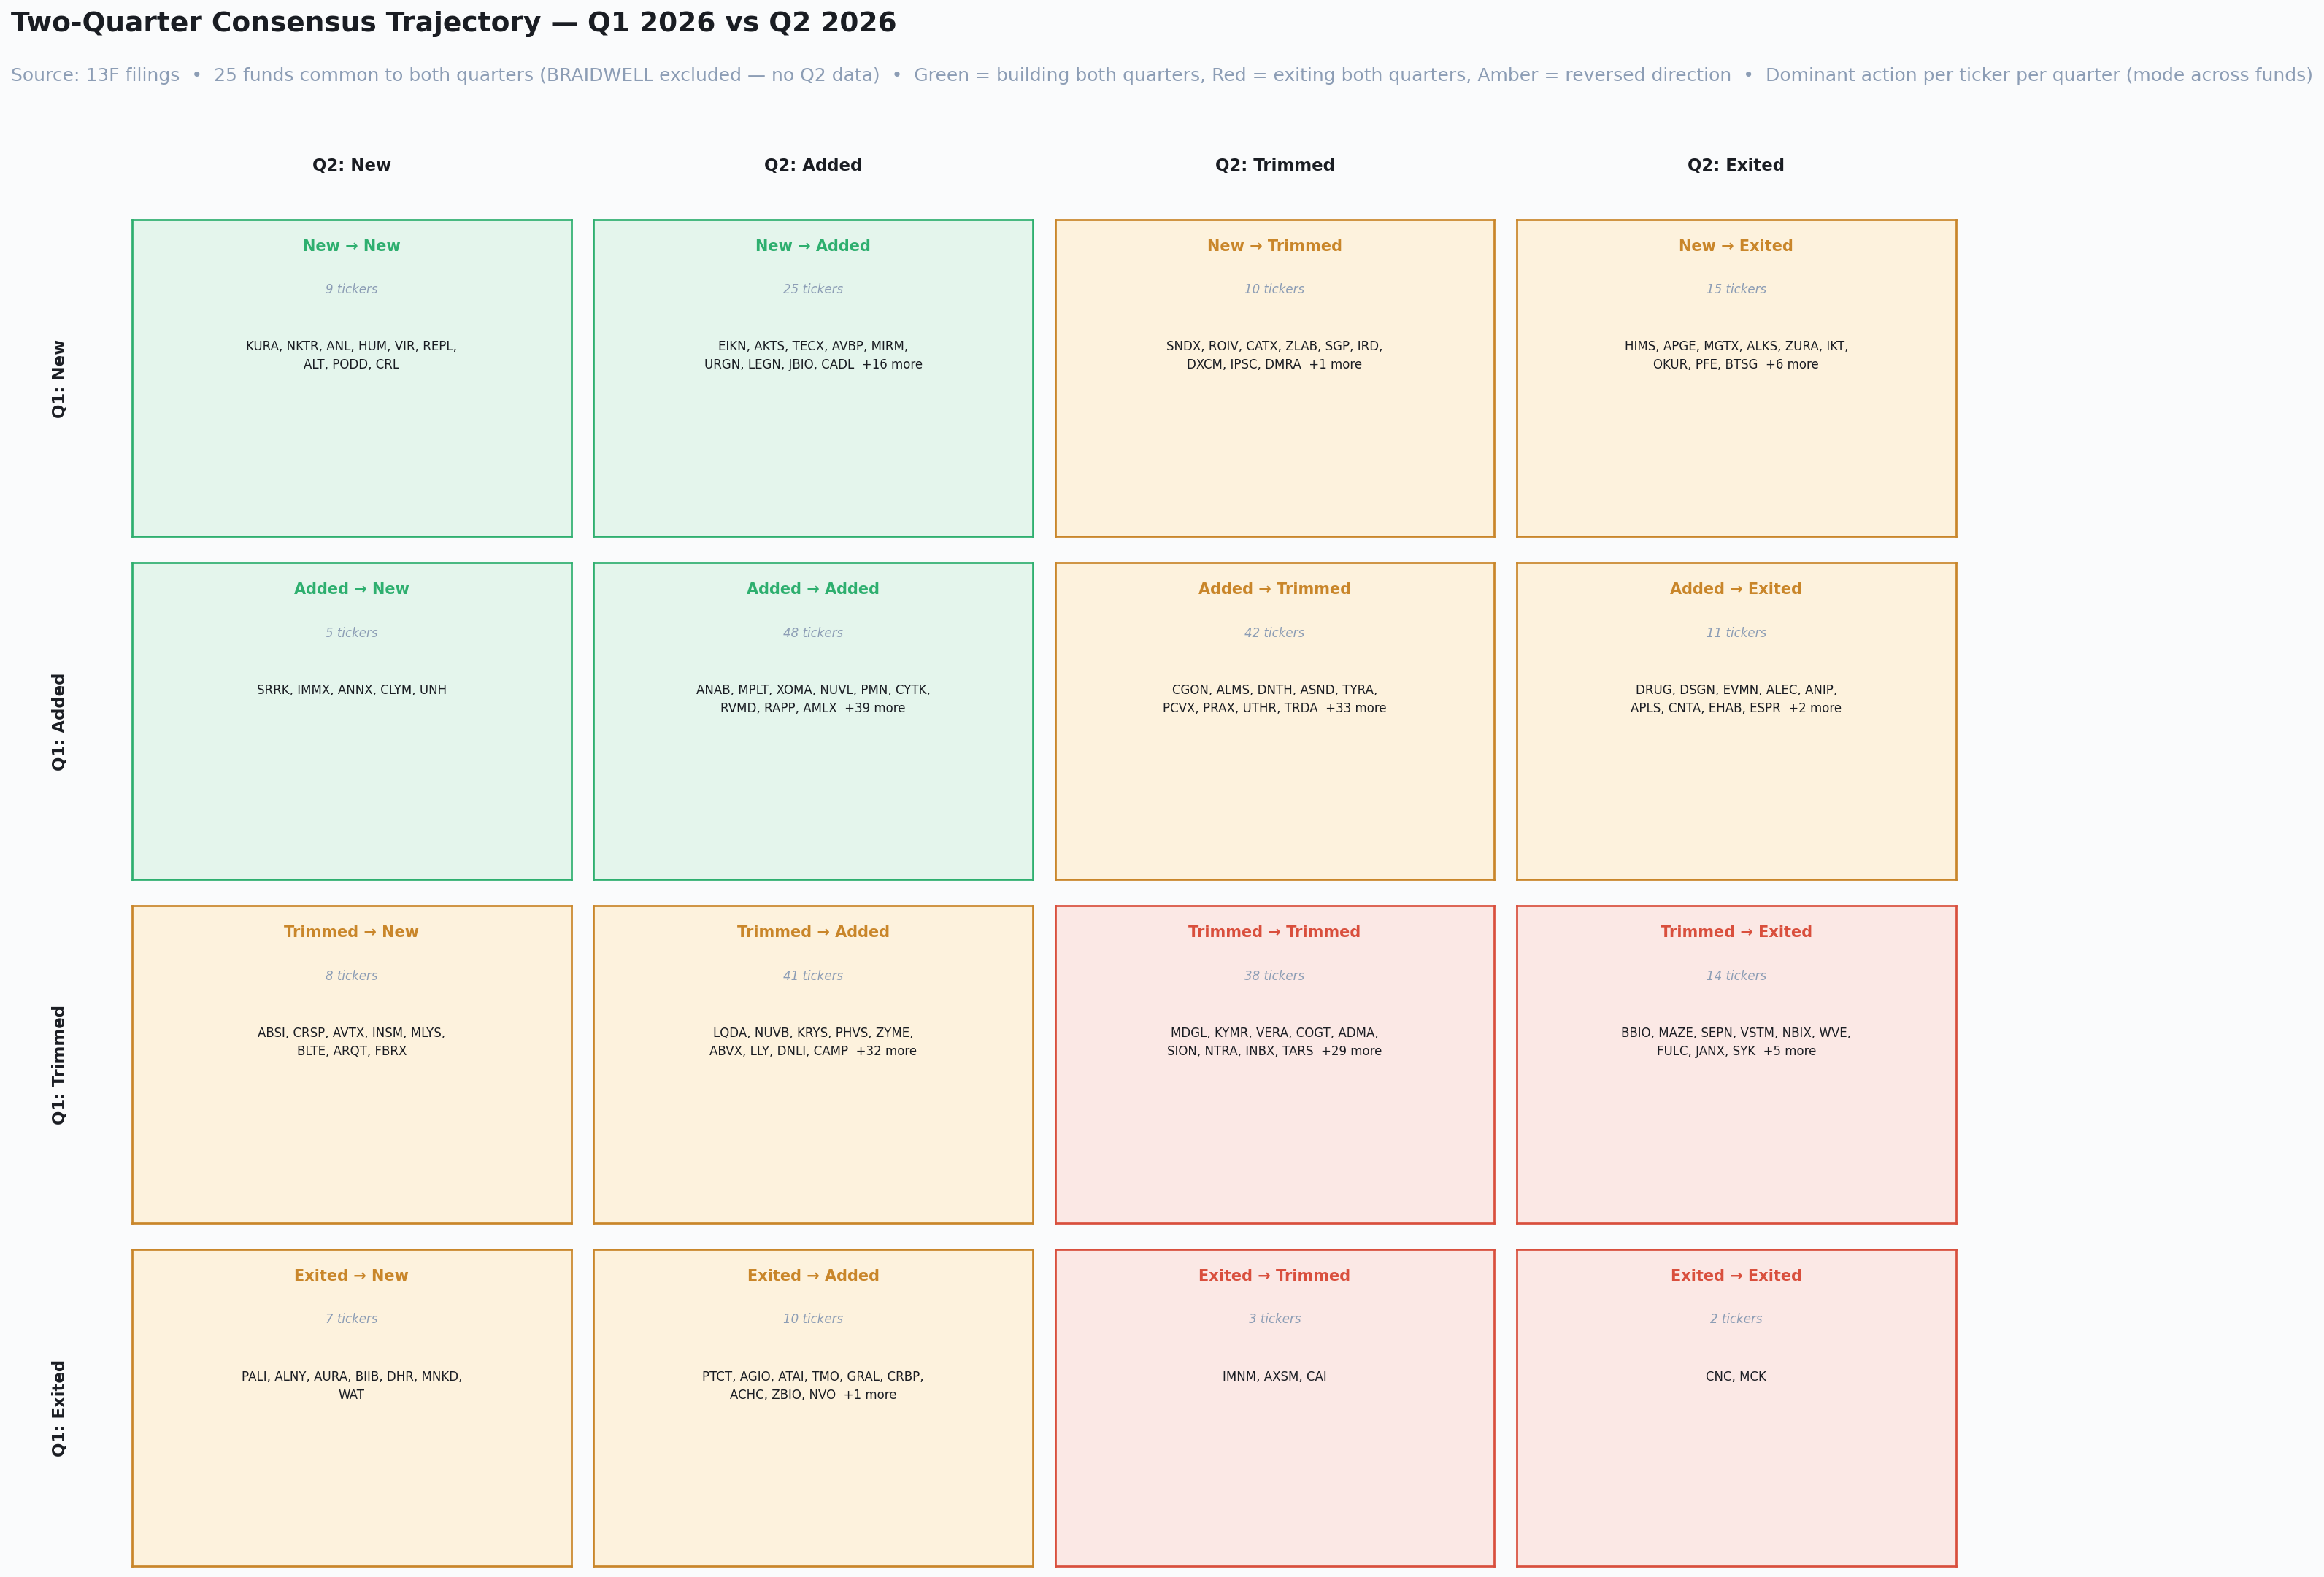
Rows are the dominant action in Q1; columns are the dominant action in Q2. Green cells indicate building in both quarters, red cells exiting in both, amber cells a reversal of direction. 25 funds common to both quarters.
Adding up the cells: 87 tickers were built in both quarters, 57 were reduced in both, and 144 — half the universe — reversed direction. That’s the headline of Q2: this was a rotation quarter, not a continuation one.
It also lets me check last quarter’s calls. Of the Q1 coordinated initiations, AKTS followed through (New → Added) and sits among the names building consensus in both quarters. DMRA, tied with AKTS at five initiating funds in Q1, reversed (New → Trimmed), and ZURA was exited entirely. In hindsight, AKTS was itself a January 2026 IPO, so part of its Q1 “coordinated initiation” was the same IPO effect described above — a correction to how I read it last quarter. Coordinated initiations can be a strong signal, but in this sample it held for one of the top two names, not both.
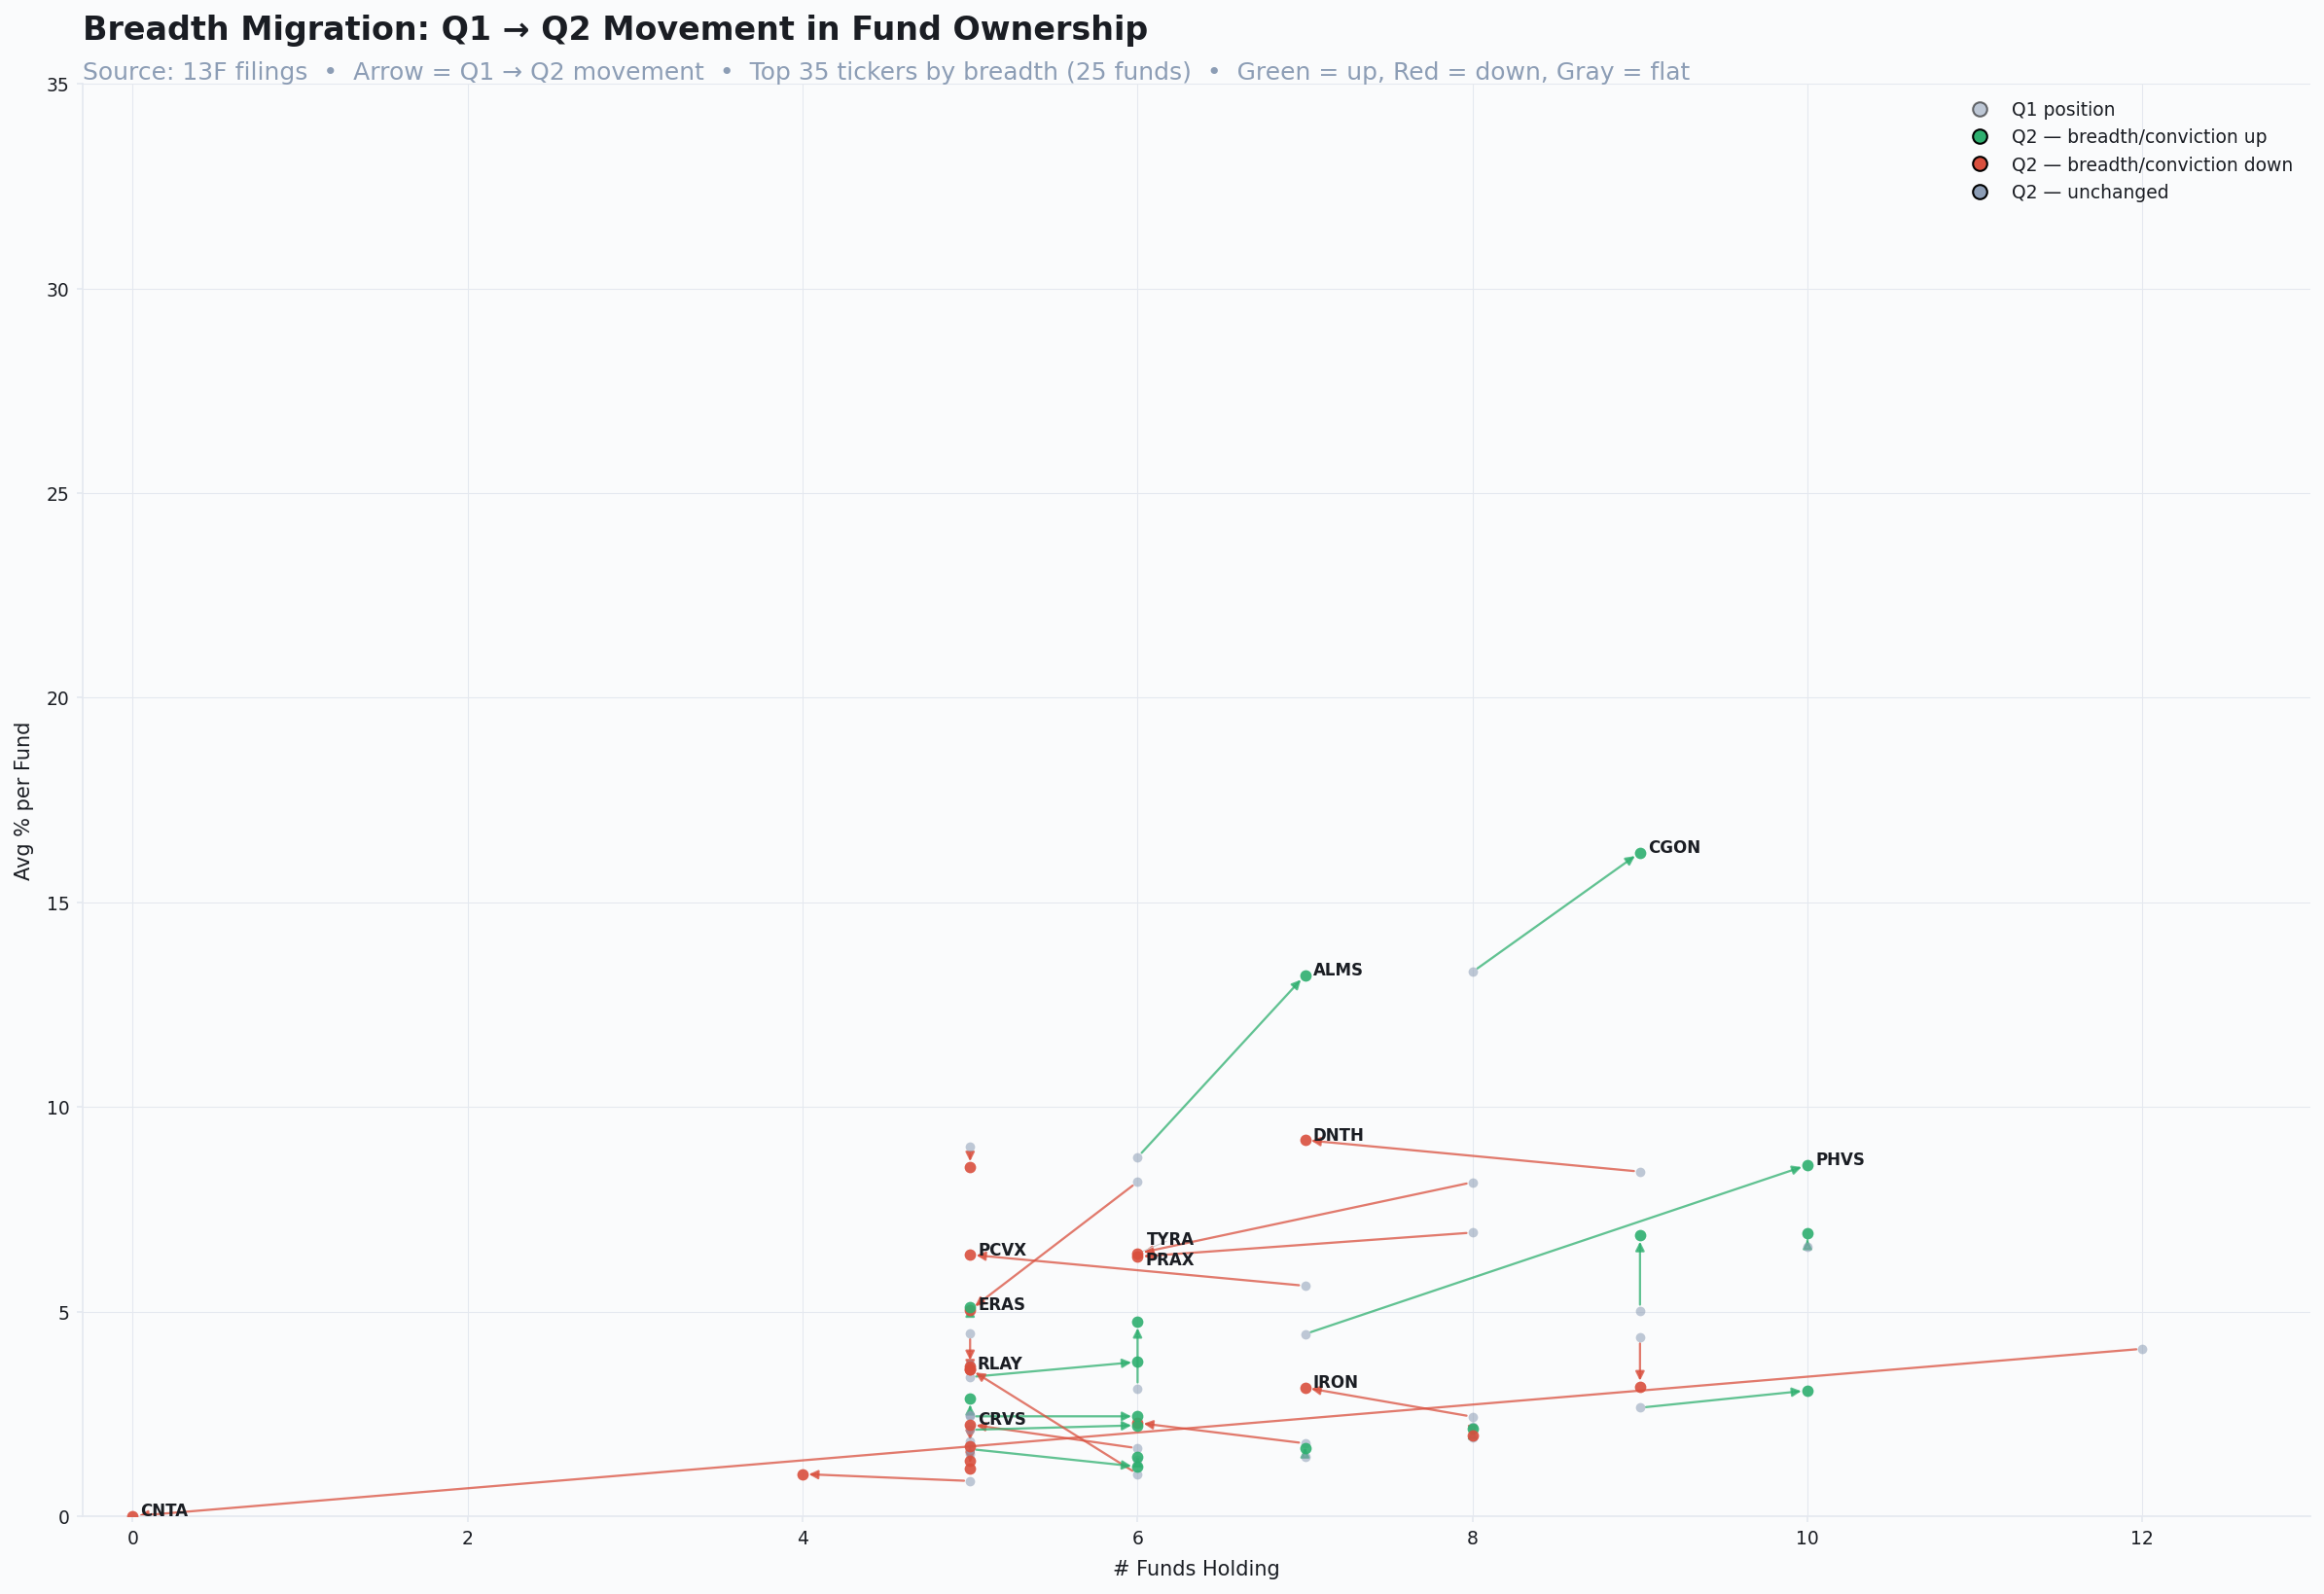
Each arrow runs from a ticker’s Q1 position to its Q2 position. Green indicates breadth or conviction rising; red falling; gray unchanged.
The migration chart shows which way names moved in the breadth-versus-weight plane. PHVS is the clearest upward mover — from seven funds to ten, with average weight roughly doubling — which is how it joined the top of the most-widely-held list. CNTA’s long arrow to zero is the Lilly acquisition, not a loss of conviction.
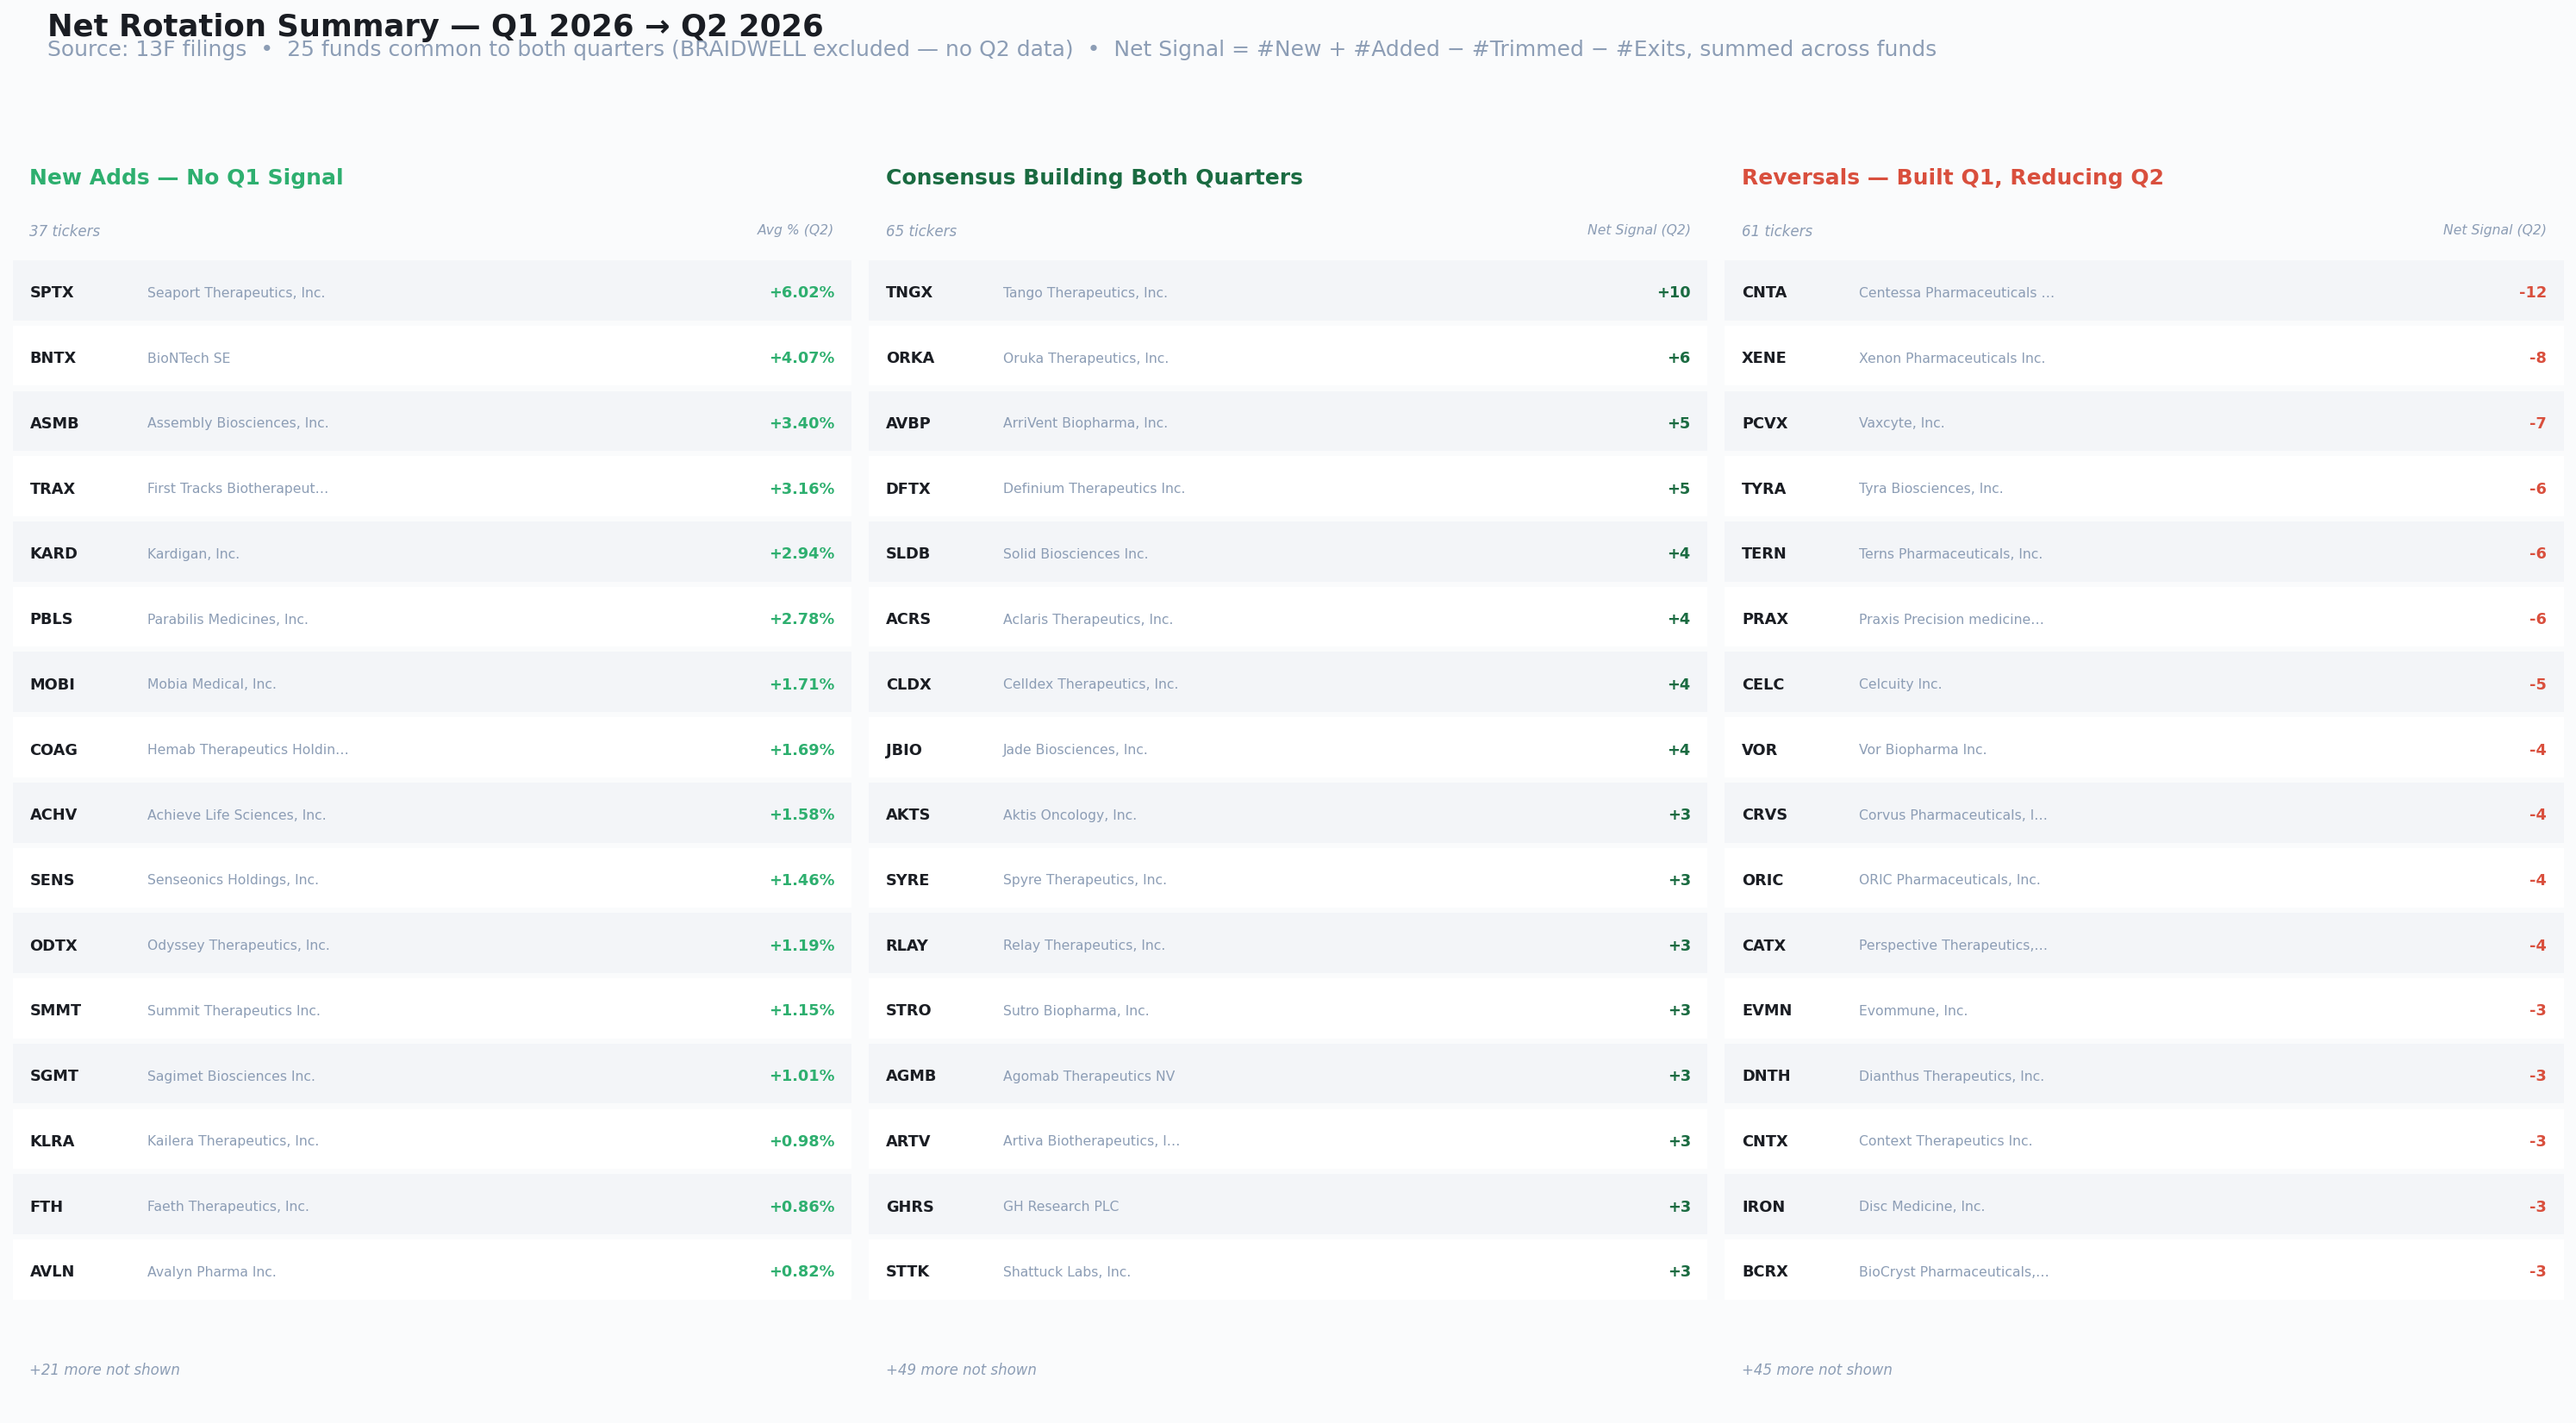
Net Signal = number of funds New + Added − Trimmed − Exited, summed across funds. 25 funds common to both quarters.
The net rotation summary condenses all of this into three lists. TNGX leads the consensus-building column at +10, the most one-directional support of any name across both quarters. Two psychedelics names appear in the same column — DFTX (+5) and GHRS (+3), both names from the psychedelics sector. The new-adds column is led largely by fresh IPOs (SPTX, PBLS, KLRA, and others), for the reasons above. The reversals column is led by CNTA — the acquisition, not a reversal of view — and then XENE (−8), consistent with its all-red row on the signal map.
ContextHow concentrated are the funds themselves?
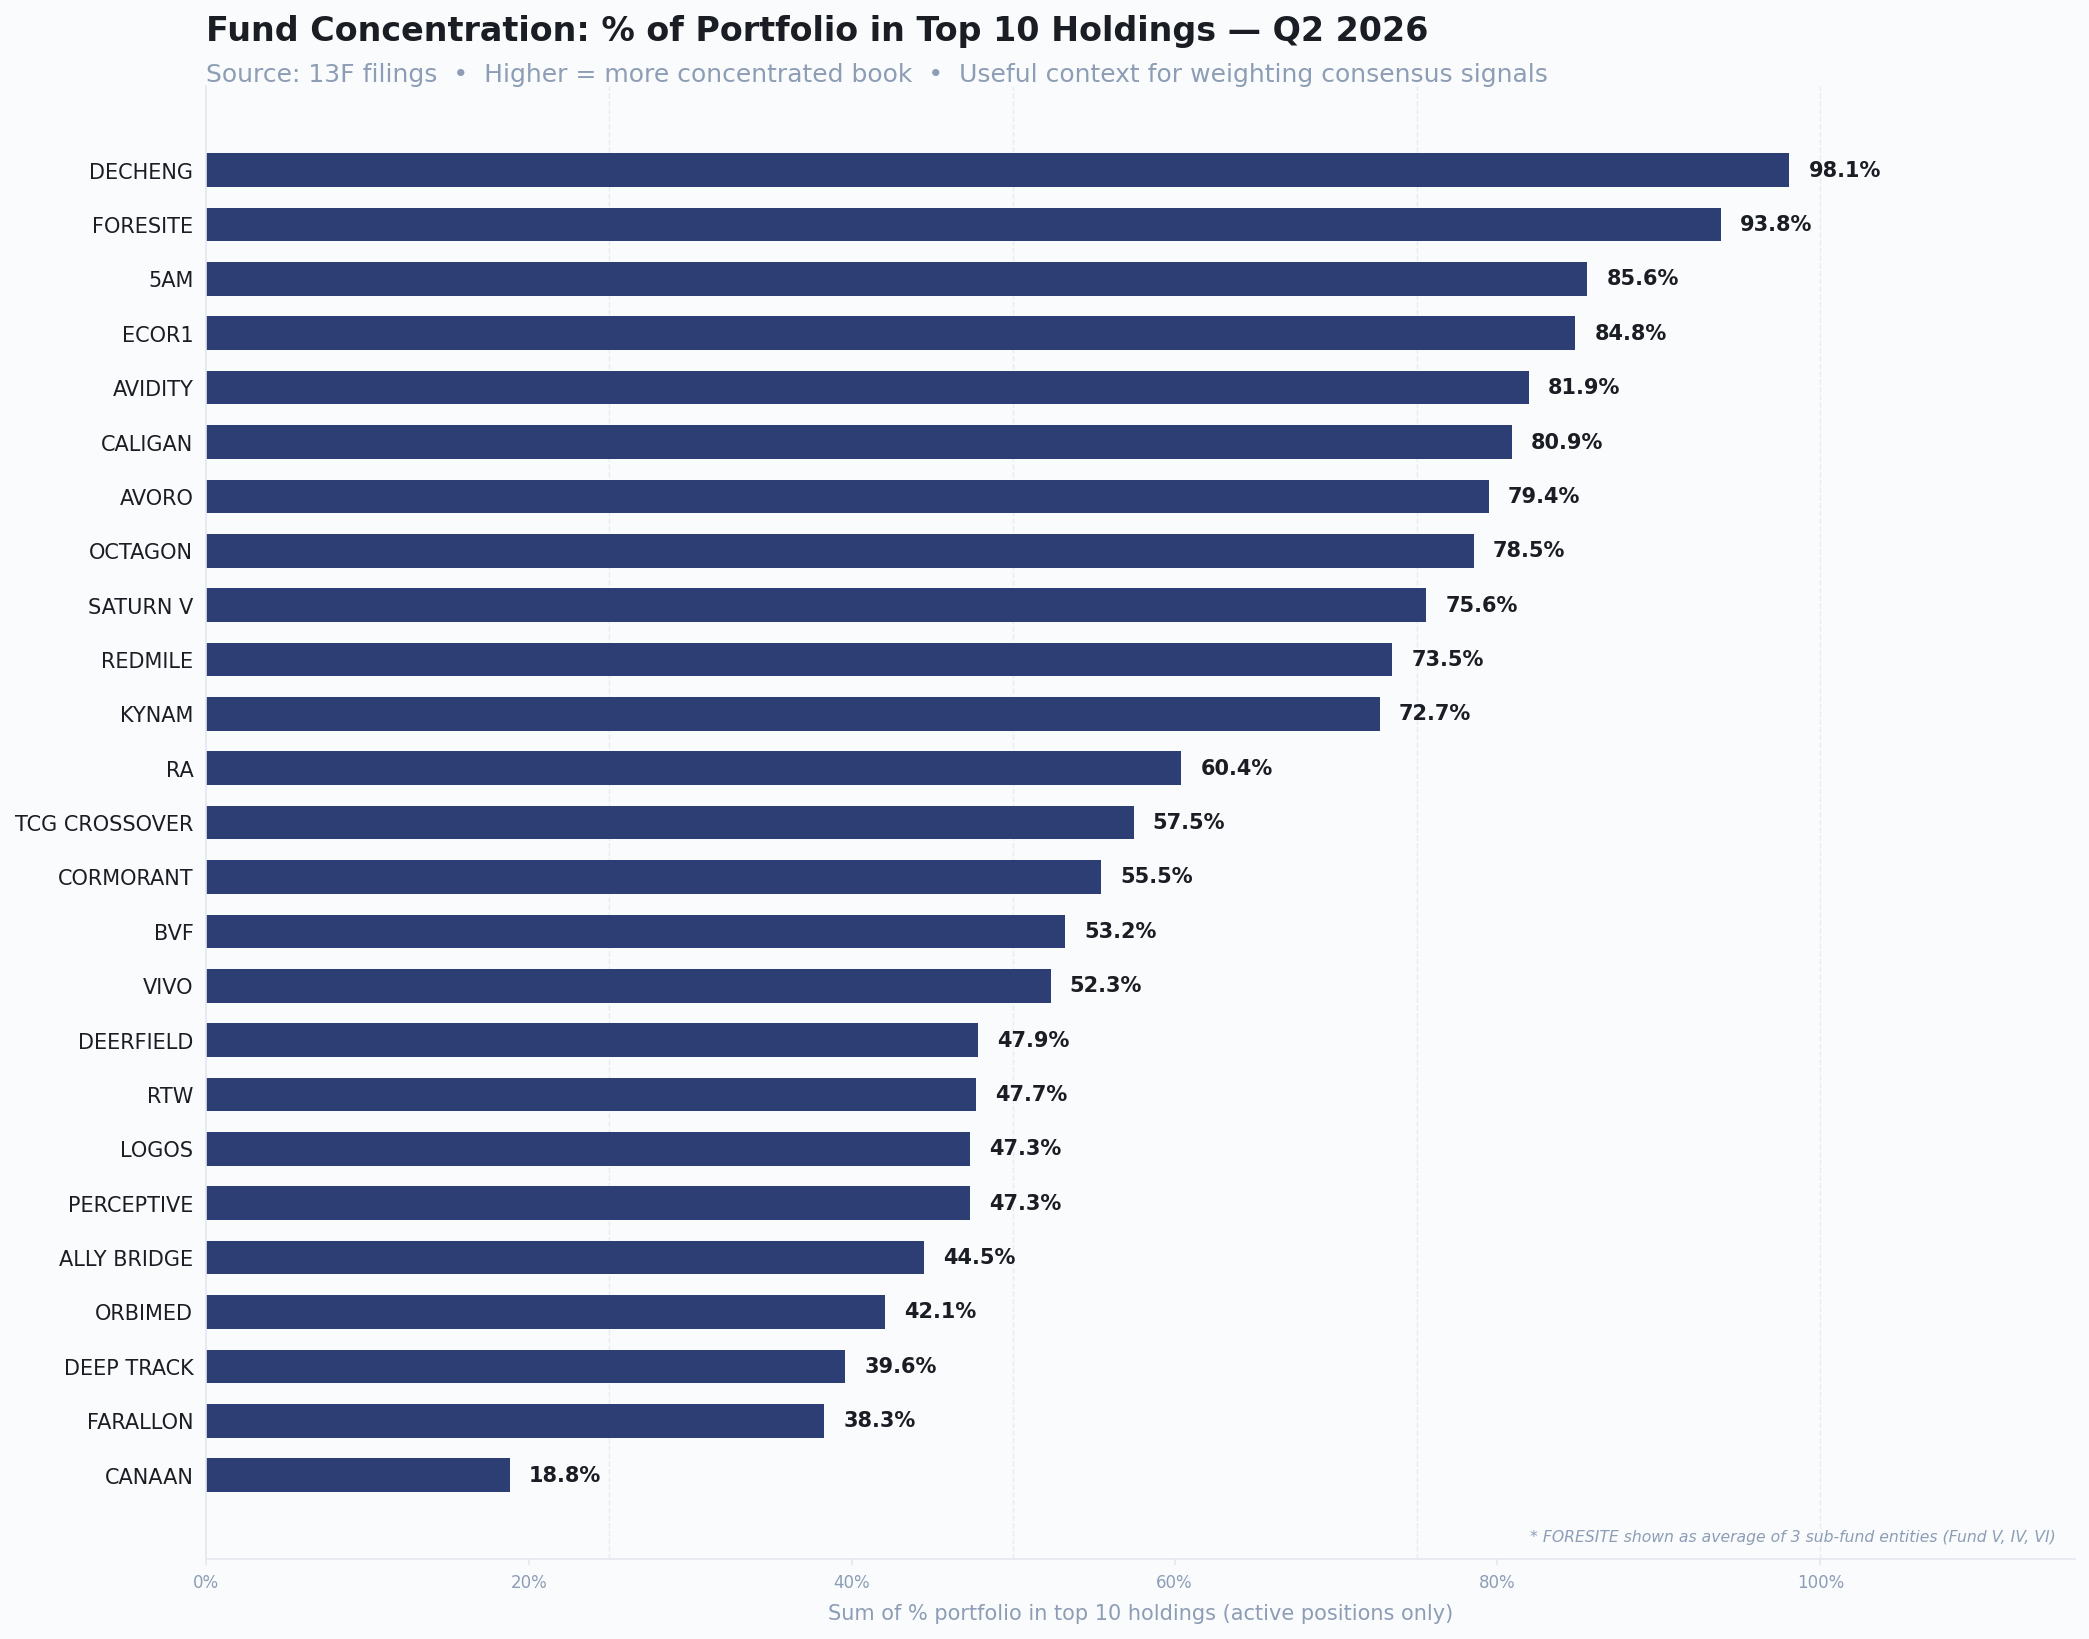
Sum of portfolio weight in each fund’s top ten holdings (active positions only). Foresite shown as the average of three sub-fund entities.
One more piece of context for weighting all of the above. At one end, Decheng holds 98% of its reported book in its top ten names; at the other, Canaan holds under 19%. A new position from a highly concentrated fund is a much bigger decision than the same entry from a diversified one — which is why the stacked bars in the shifts chart matter as much as the totals.
SynthesisWhat this quarter actually shows
Three observations worth carrying forward. Q2 was a rotation quarter — half the universe changed direction from Q1, far more than persisted in either direction. M&A did a lot of the work — the largest “exits” were takeovers, including the Q1 consensus leader, which reads less as abandonment and more as consensus being validated. And the IPO window shaped the new-position data — most of the quarter’s biggest coordinated initiations were fresh listings where pre-IPO stakes became visible, and the organic signal in already-listed names (led by AURA) is more modest.
The names to watch into Q3 are the ones that sit on both sides of that picture: AURA and the other organic Q2 initiations (do they follow through like AKTS, or reverse like DMRA?), and whether the new IPO holders add or sell once lock-ups expire and the consensus-builders in both quarters, led by TNGX. Q3 filings will be the first real test of whether coordinated entries predict continued building.
Tooling, methodology, and the analyst infrastructure that produced this brief are documented in the 13F Biotech Intelligence Tool writeup.
Methodology & Disclosures
Coverage universe: twenty-five biotech-focused hedge funds. One fund from the Q1 universe (Braidwell) is excluded from Q2 because its source pages could not be captured cleanly; all quarter-over-quarter comparisons use the twenty-five funds common to both quarters, so Q1 counts in this brief may differ slightly from the Q1 brief. Positions extracted from publicly filed 13F disclosures via WhaleWisdom and processed through the 13F Intelligence Tool. A policy filter restricts the dataset to healthcare-sector equities (excluding warrants, options, and convertibles) where the position represents at least 0.5% of portfolio or has changed by at least 0.25 percentage points quarter over quarter. In Q1, non-healthcare names and options/warrant rows were removed manually after extraction; from Q2 the same rules are applied programmatically to each row, which may produce small differences between the two quarters.
13F data is lagged by 45 days from quarter-end and reports long positions only. Short positions, derivative exposures, and intra-quarter trading are not visible. Positions reflect filings as of the reporting date; positions may have changed since.
This brief is for educational and informational purposes only. It is not investment advice and does not constitute a recommendation to buy, sell, or hold any security. The author is a student; analysis reflects pattern observation, not professional research.