2026 Biotech HF Positioning —— Q1
What twenty-six biotech-focused and general funds did in the first quarter of 2026 — and a few patterns worth paying attention to.
Every quarter, hedge funds with a biotech department or focus disclose their long positions in 13F filings — a public, lagged window into where the smart money sits. This brief takes that data across twenty-six funds and looks for the patterns that survive aggregation: where conviction concentrates, where it scatters, what's being bought together, and what's being abandoned together.
The LandscapeOverview whole quarter
Before analyzing specific metrics, this chart depicts a fund-by-ticker signal map of the top twenty-five most widely held names, with each cell showing what each fund did with that position this quarter. Greens are positions being built (Added or New); reds are positions being reduced or exited (Trimmed or Exited); gray means the fund doesn't hold the name.
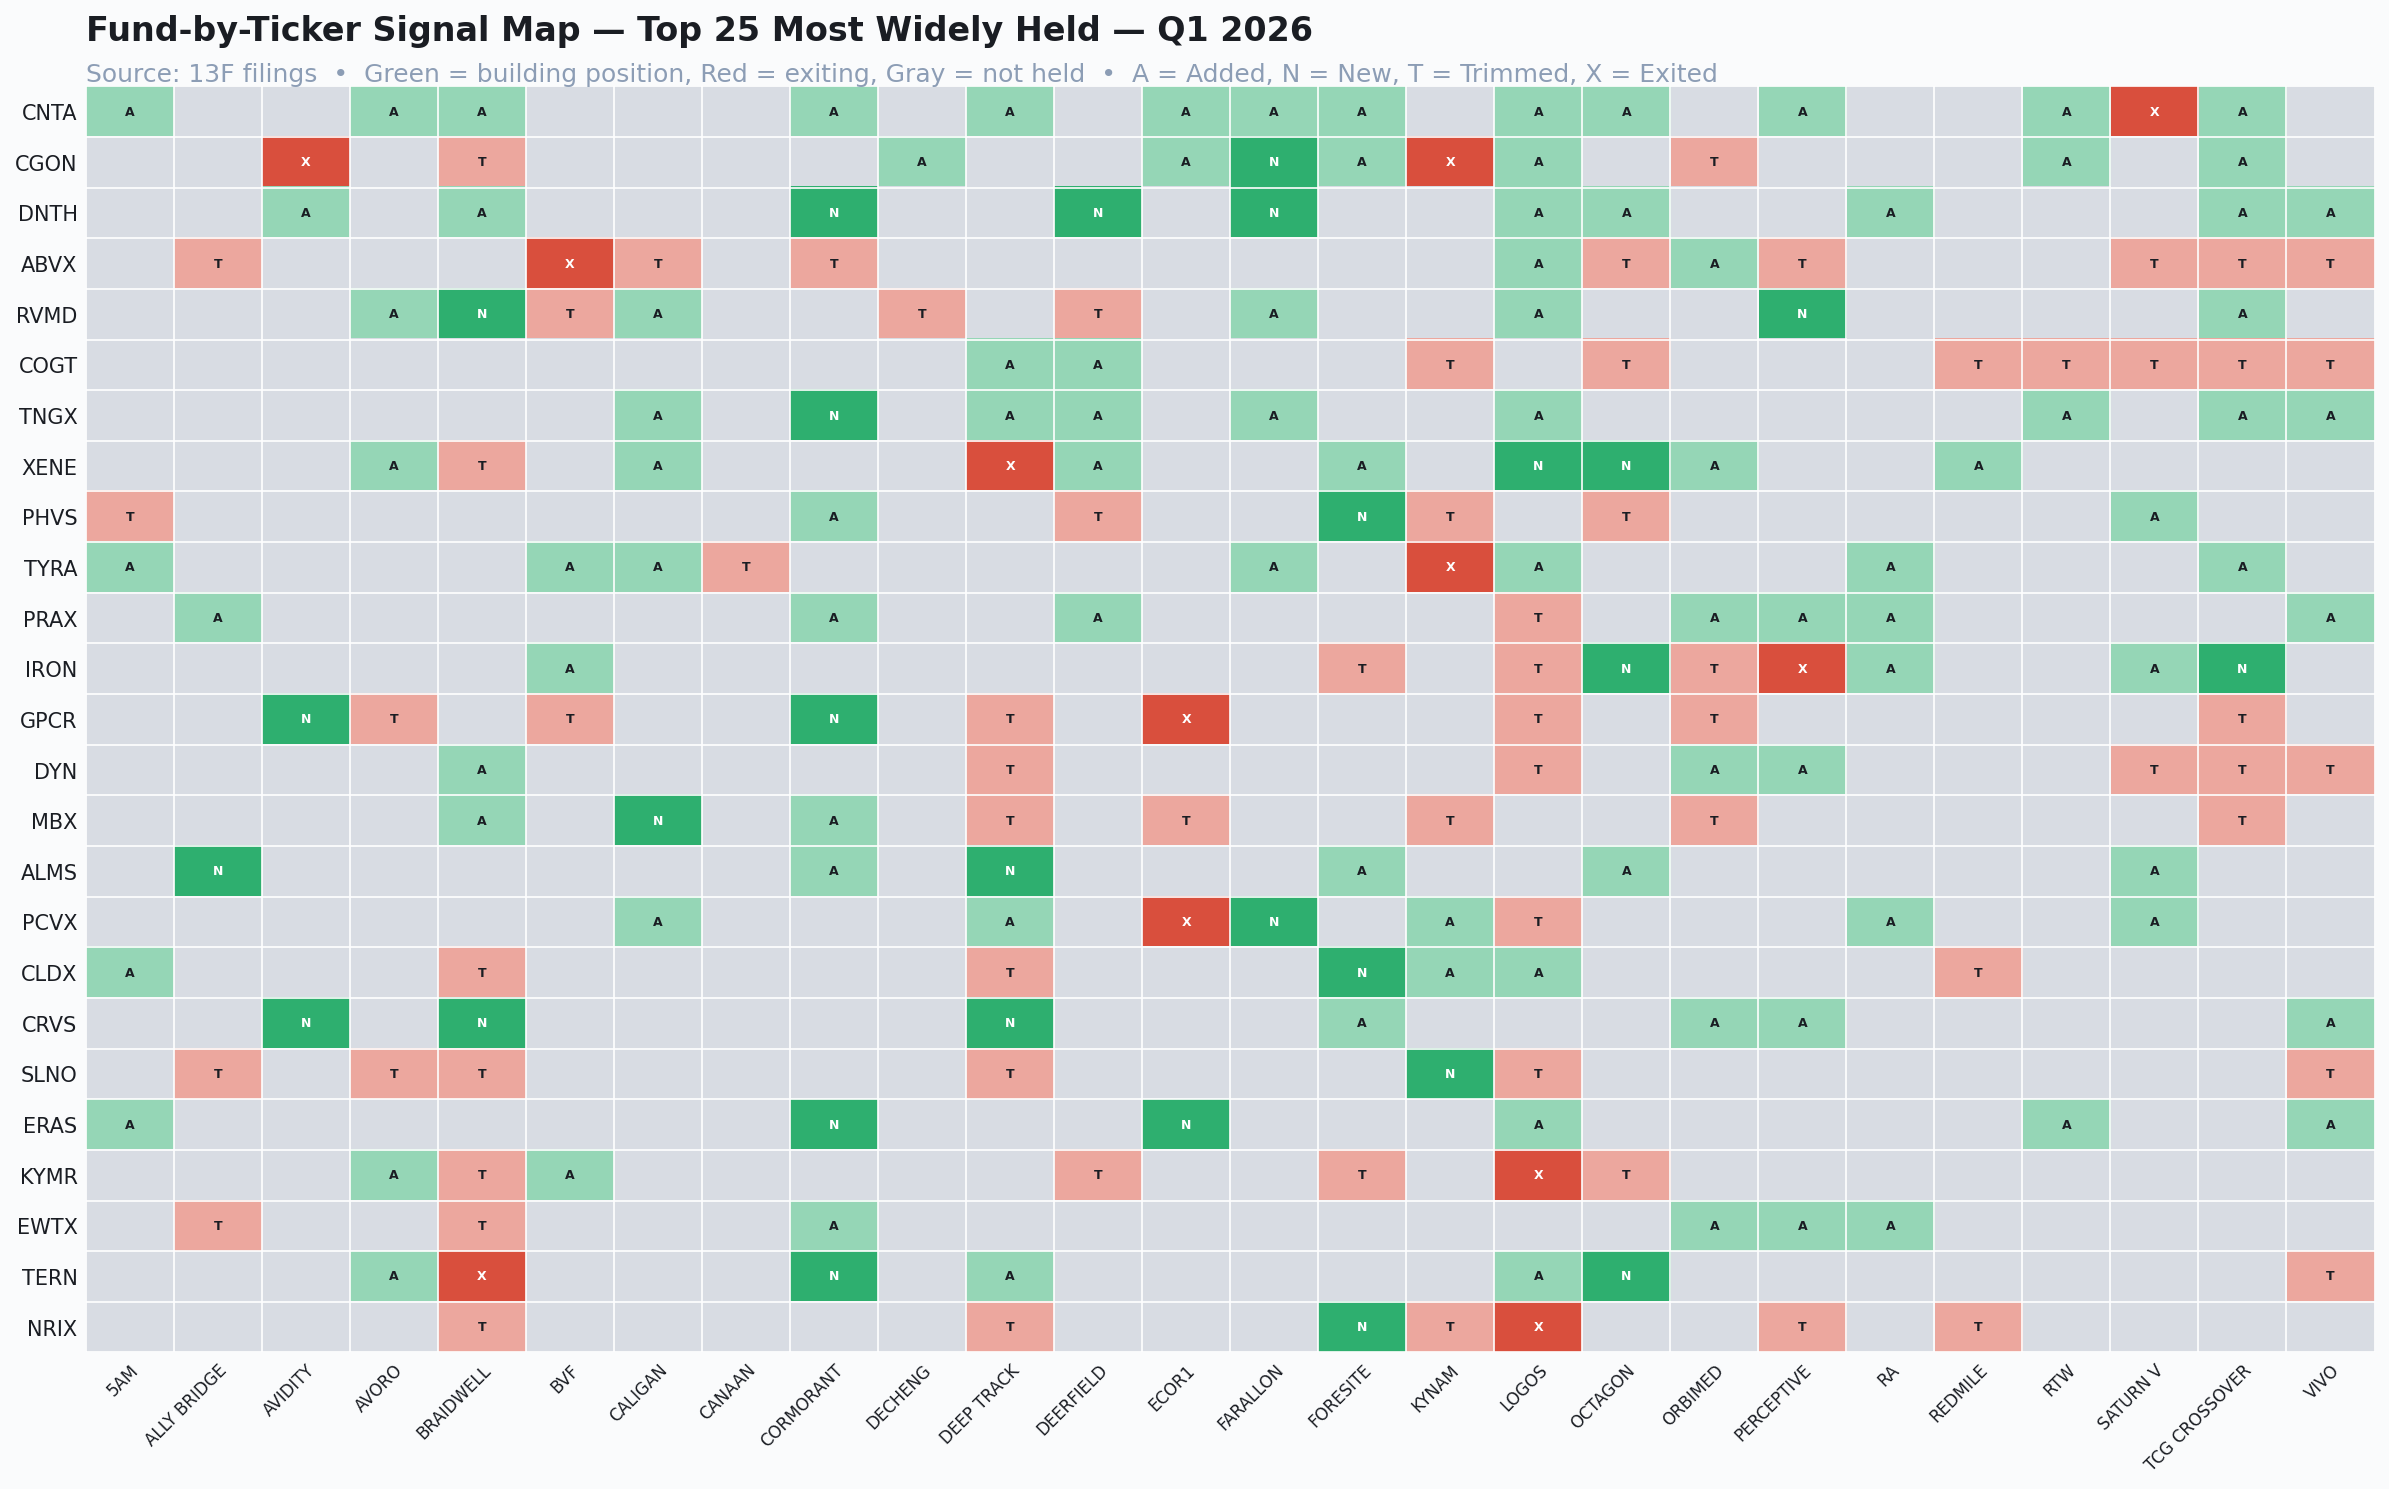
Each row is a ticker; each column is a fund. Green cells indicate the fund added to or initiated the position this quarter; red cells indicate trimming or full exit; gray indicates no holding.
One way to interpret this map that I’ve found derived meaningful analysis is column-by-column, specifically looking at the actions an individual fund took regarding the top-25 companies. First, Cormorant is the most green-skewed on the chart – with 11 additions and new positions and only 1 exit. Similarly, Octagon and RA show similar trends but to a lesser extent, with 3 new positions and 6 additions respectively. Comparatively, Kynam and LOGOS demonstrate the reverse – two full exits (CGON, TYRA) from the former and 6 trims from the latter. In addition to stock-picking preferences, these patterns also reflect the general phase the fund is in and thus the strategy they implemented in the preceding quarter. Cormorant, Octagon and RA are likely in a deployment phase with their positive signalling, while Kynam and LOGOS are likely facing redemption or rotating out of segment exposure.
However, one thing I learned from building this brief is that a single column rarely depicts the entirety of a hedge fund’s direction or strategy. First, 13F captures only long equity positions. It is entirely possible that a fund that looks like it’s exiting a name might be moving exposure into options, hedging with shorts, or rebalancing into instruments that 13F doesn’t show. The chart only depicts what funds held – not the full picture of what they’re betting on. Therefore, the results might be more meaningful to interpret with regards to what biotech companies do hedge funds have confidence in and vice versa, rather than as unified directional statements of these firms. Therefore, reading across the rows instead, two tickers stand out for different reasons. CNTA’s row is most uniformly green on the chart – it is held by 13 funds and supported across virtually all of them – reflecting a general consensus that the company has potential for growth. Conversely, while ABVX is also held broadly (11 funds, 9 trimmed, 2 added), reds dominate its row, including BVF’s full exit. This implies the previous confidence in ABVX has shrunk across the board. Both observations are reinforced by the quarter-over-quarter chart below.
ConsensusThe most widely held names
Twenty-one tickers are held by seven or more of the twenty-six funds. The clear leader is Centessa Pharmaceuticals (CNTA), held by thirteen funds — exactly half the coverage universe.
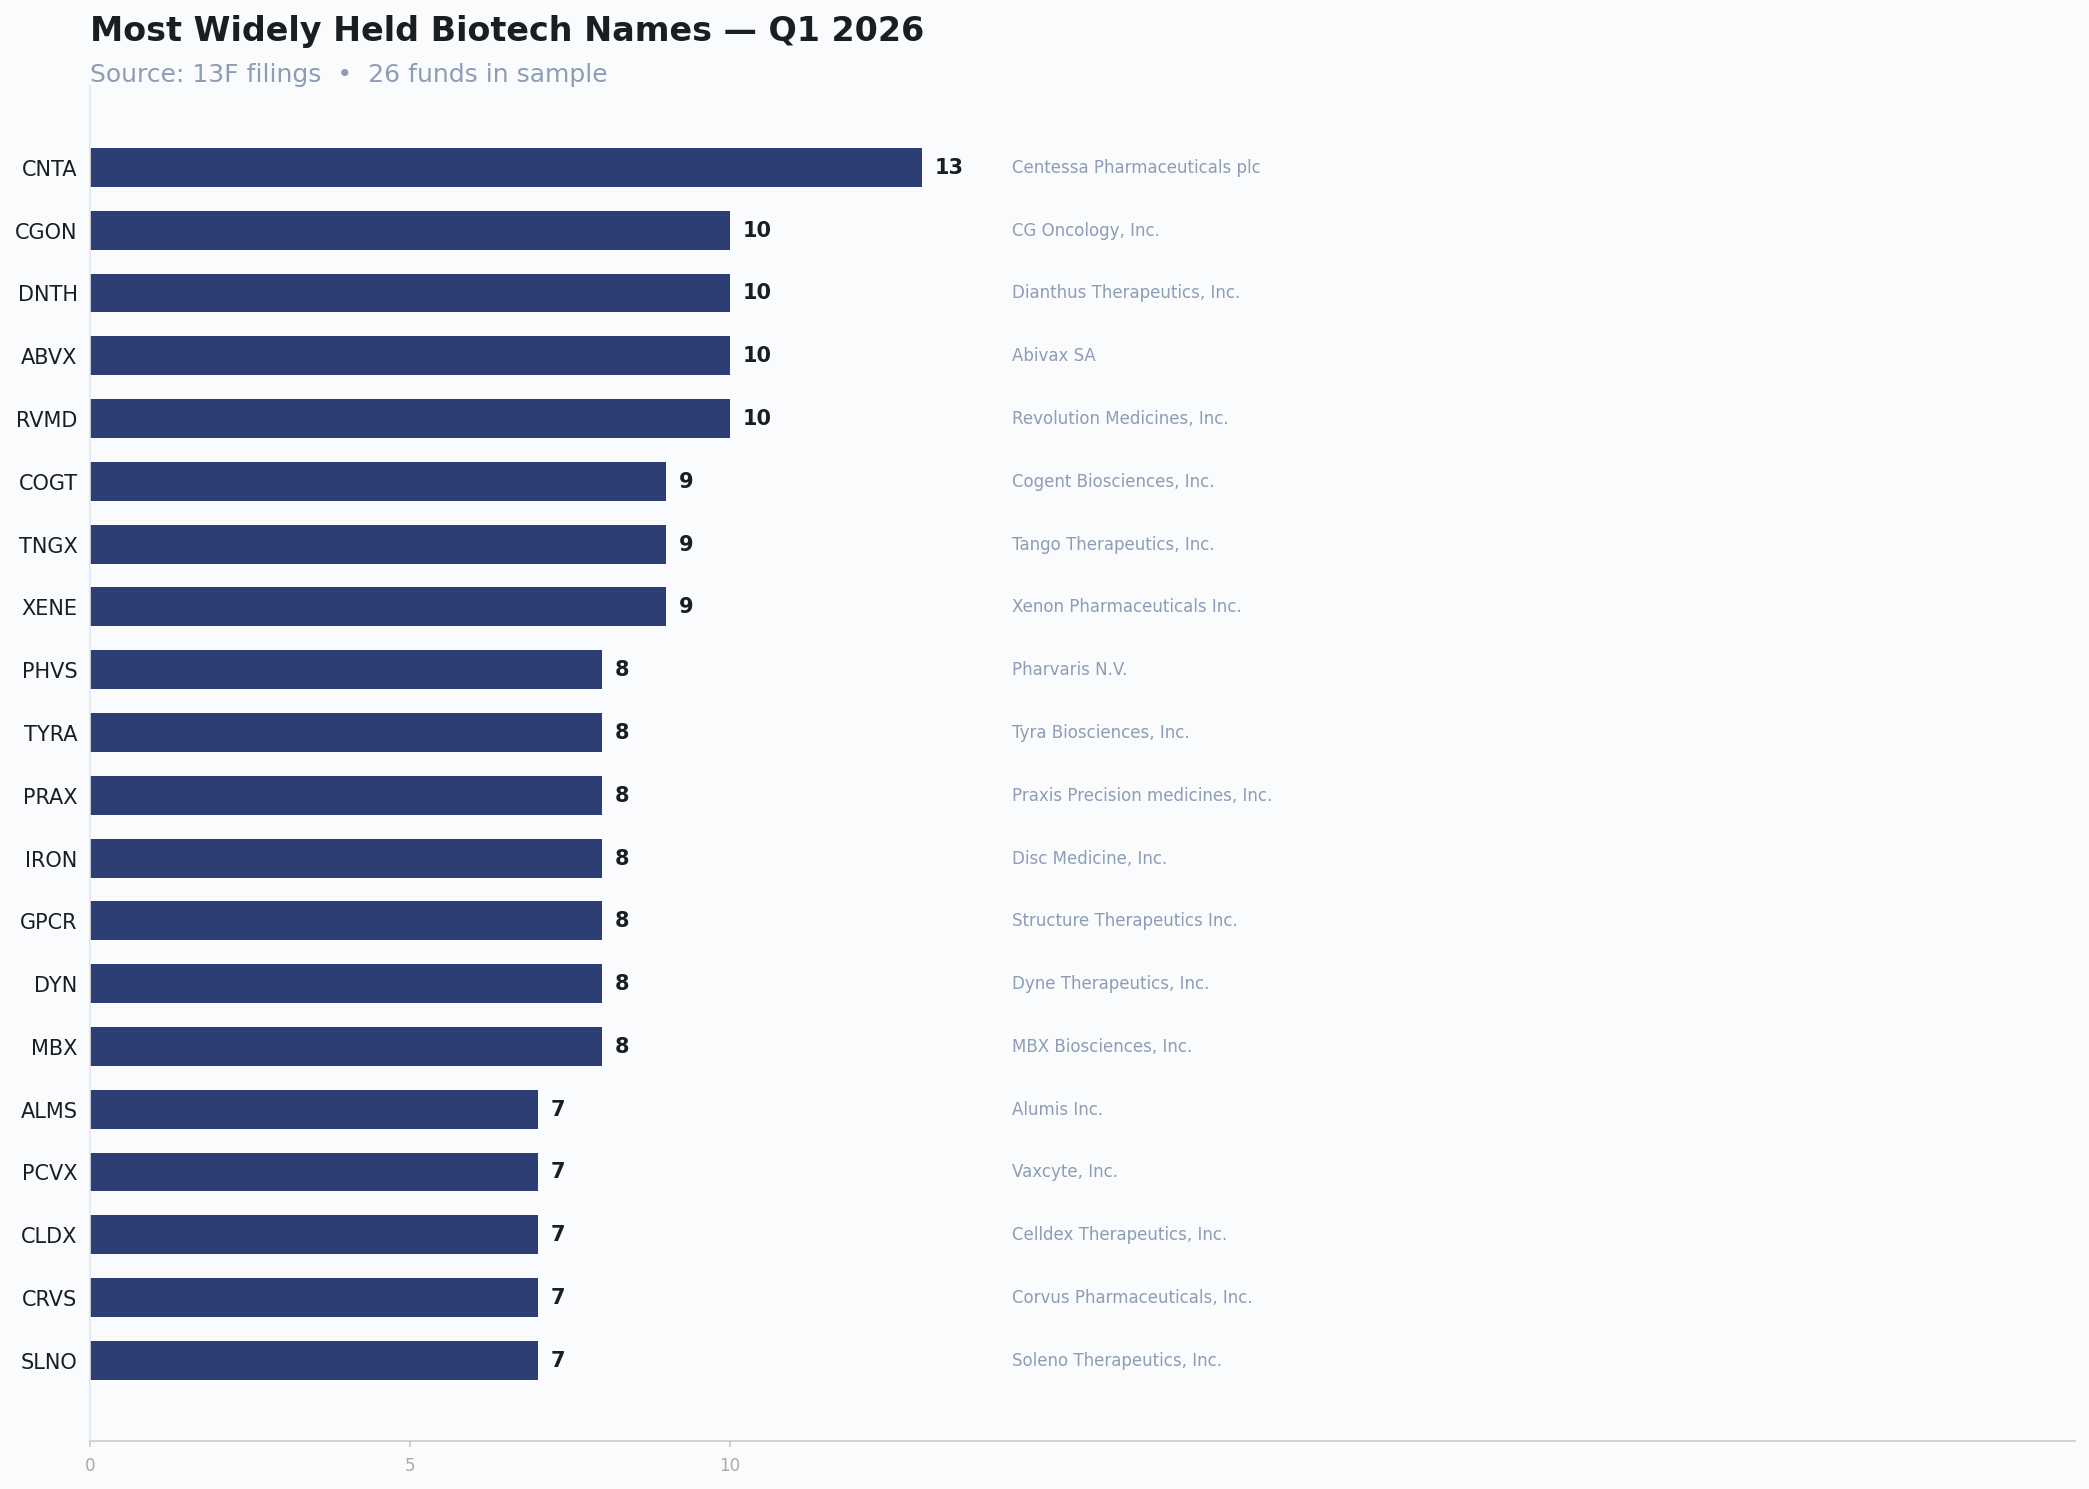
Number of funds (out of 26) holding each ticker. CNTA leads at 13; a cluster of four names — CGON, DNTH, ABVX, RVMD — share the second slot at 10.
A useful framing: a position held by ten or more funds isn't a contrarian bet. It's a sector consensus. The interesting question is not whether to own it, but whether to be late.
ConvictionHow widely held doesn't mean how strongly held
Holding a company name and weighting it are different decisions. This chart plots breadth against concentration — the number of funds holding a name (horizontal) against the average size of the position for the funds that hold it (vertical). Where a dot sits and how widely owned it is can have vastly different interpretations.
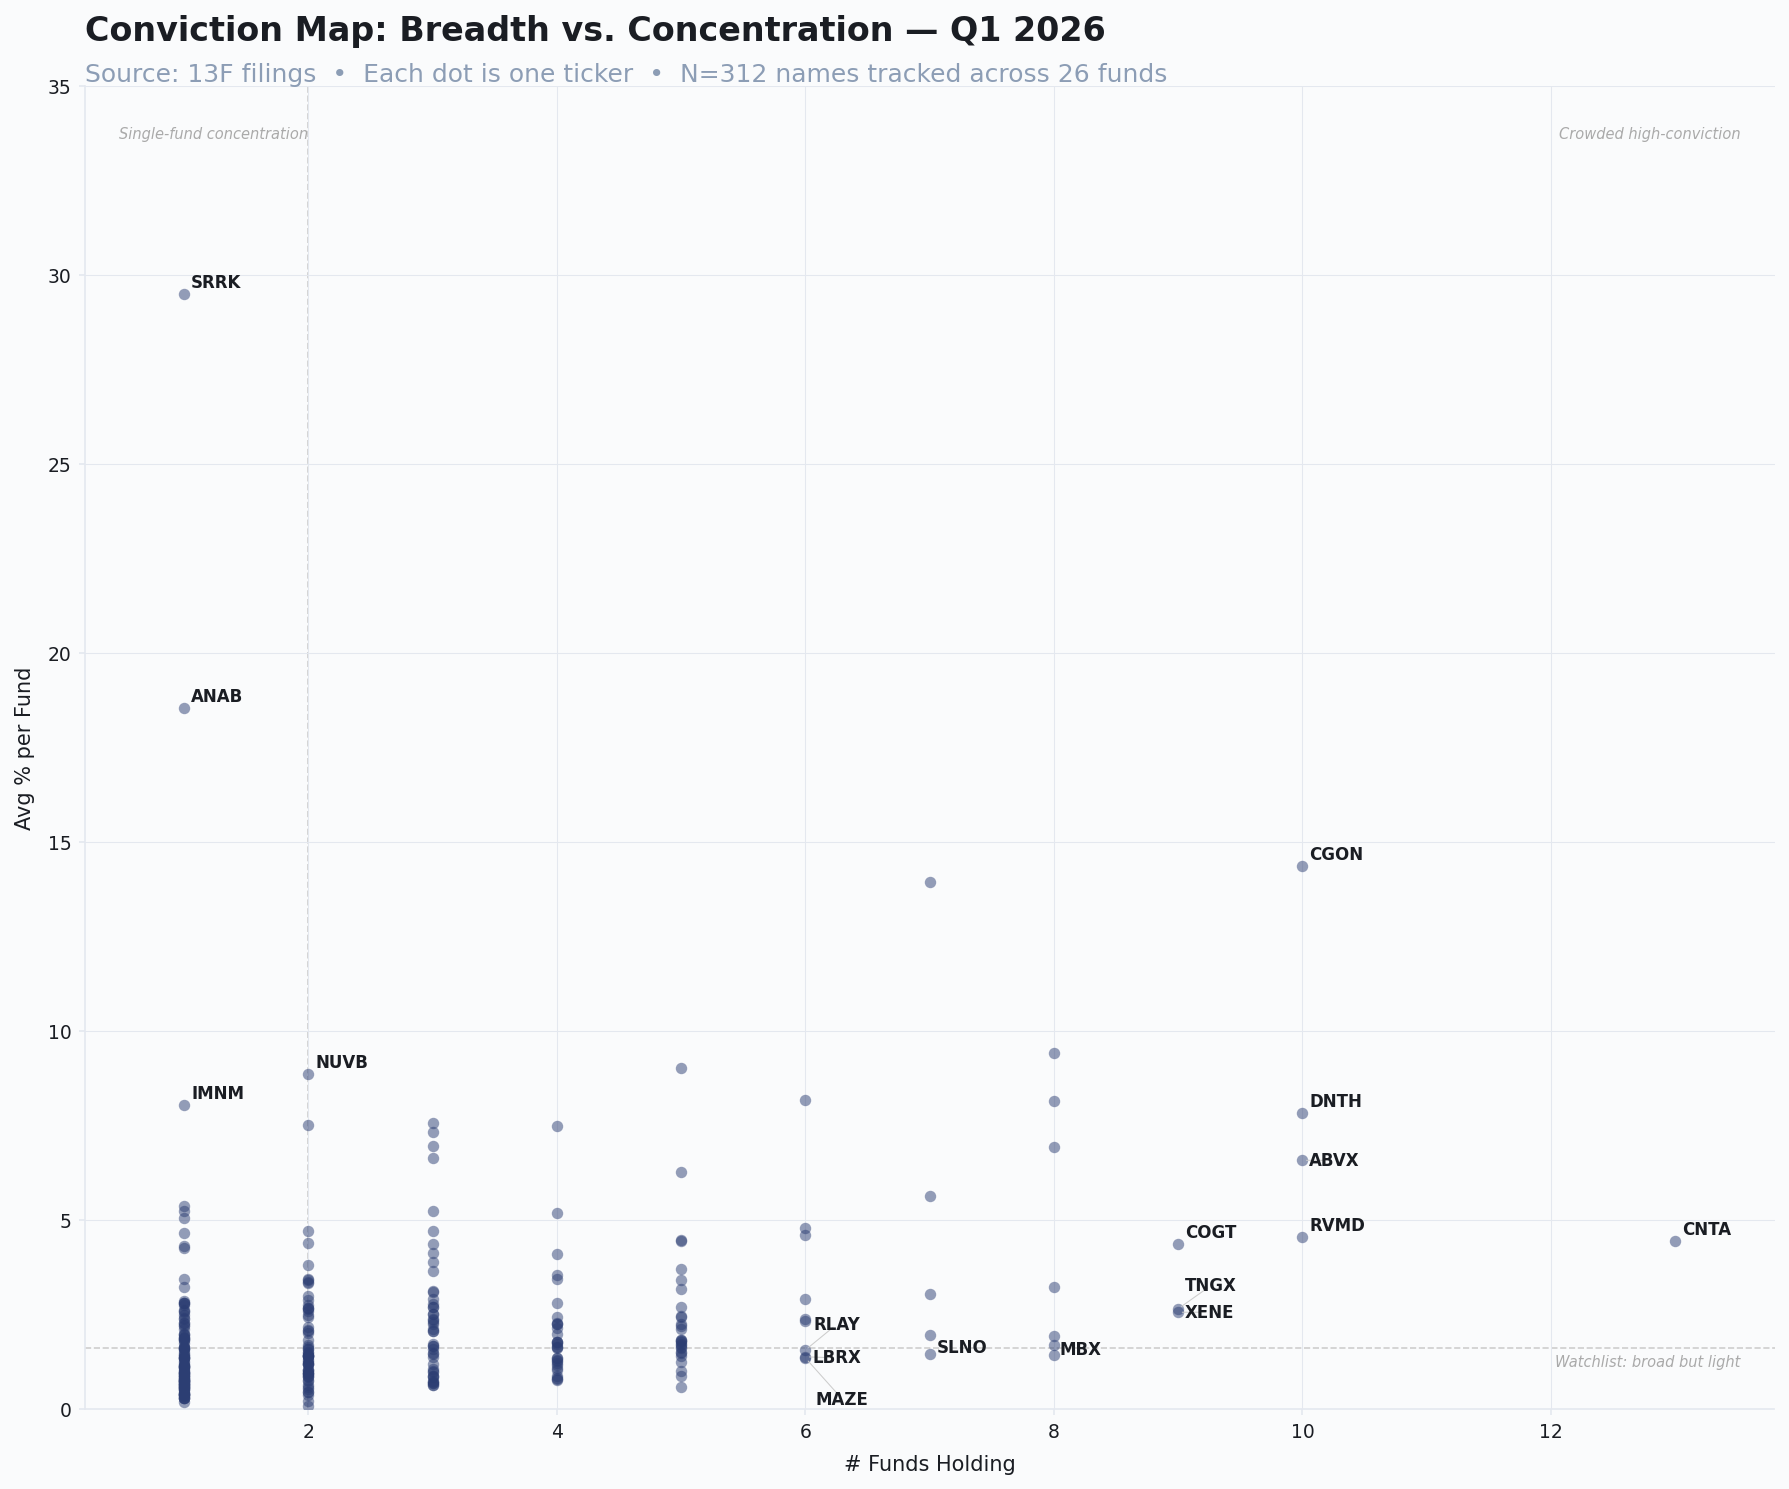
Each dot is one ticker. Top-right would indicate a name that is both widely held and heavily weighted — crowded high-conviction. Top-left indicates single-fund concentration. Bottom-right indicates broad but light holdings. Most of the universe sits in the bottom-left.
The first notable observation is the emptiness of the top-right section, demonstrating the fact that for Q1 there is not a company where there is a unanimous high conviction (i.e. widely held and heavily weighted) among the funds. CGON is the closest — ten funds hold it, at an average weight of around ~14%. This implies that a meaningful number of funds independently decided it was worth not just owning, but sizing up in holdings as well. Everything else widely held (CNTA, RVMD, DNTH, ABVX) sits lower on the vertical axis — owned broadly, but in modest size.
On the other hand, there are a few firms populating the opposite corner that send a different message. For instance, SRRK sits almost alone — only one fund holds it, but it takes up roughly 30% of that fund's book. ANAB indicates a similar pattern at a smaller magnitude. These single-fund conviction bets demonstrate a certain ambiguity (in that the rest of the industry has not followed yet) which is worth looking into. However, it is also important to note that a 13F only reports U.S. listed equities — it says nothing about a fund's private holdings. Many crossover funds invest heavily in private biotechs before those companies go public, and none of that conviction shows up here. A fund could be building a high-conviction position in a pre-IPO biotech company that won't appear on this file. Some funds might also request confidential treatment for certain positions while they're still accumulating, which also prevents those names from appearing on public listings for some time. Therefore, whatever appears on a 13F is not the full picture.
The main lesson I learned from this chart is that crowdedness and conviction are not the same property. A position owned by twelve funds at 1% each and a position owned by three funds at 15% each are both consensus, but represent different levels and types of belief.
ShiftsThe largest moves of the quarter
Aggregating quarter-over-quarter change across all twenty-six funds surfaces the names where positioning moved the most. But the aggregate number hides something worth noticing – a large swing can come from many funds each shifting a little, or from one fund shifting a lot. The stacked segments in each bar show which – and the distinction changes how much to read into the headline figure.
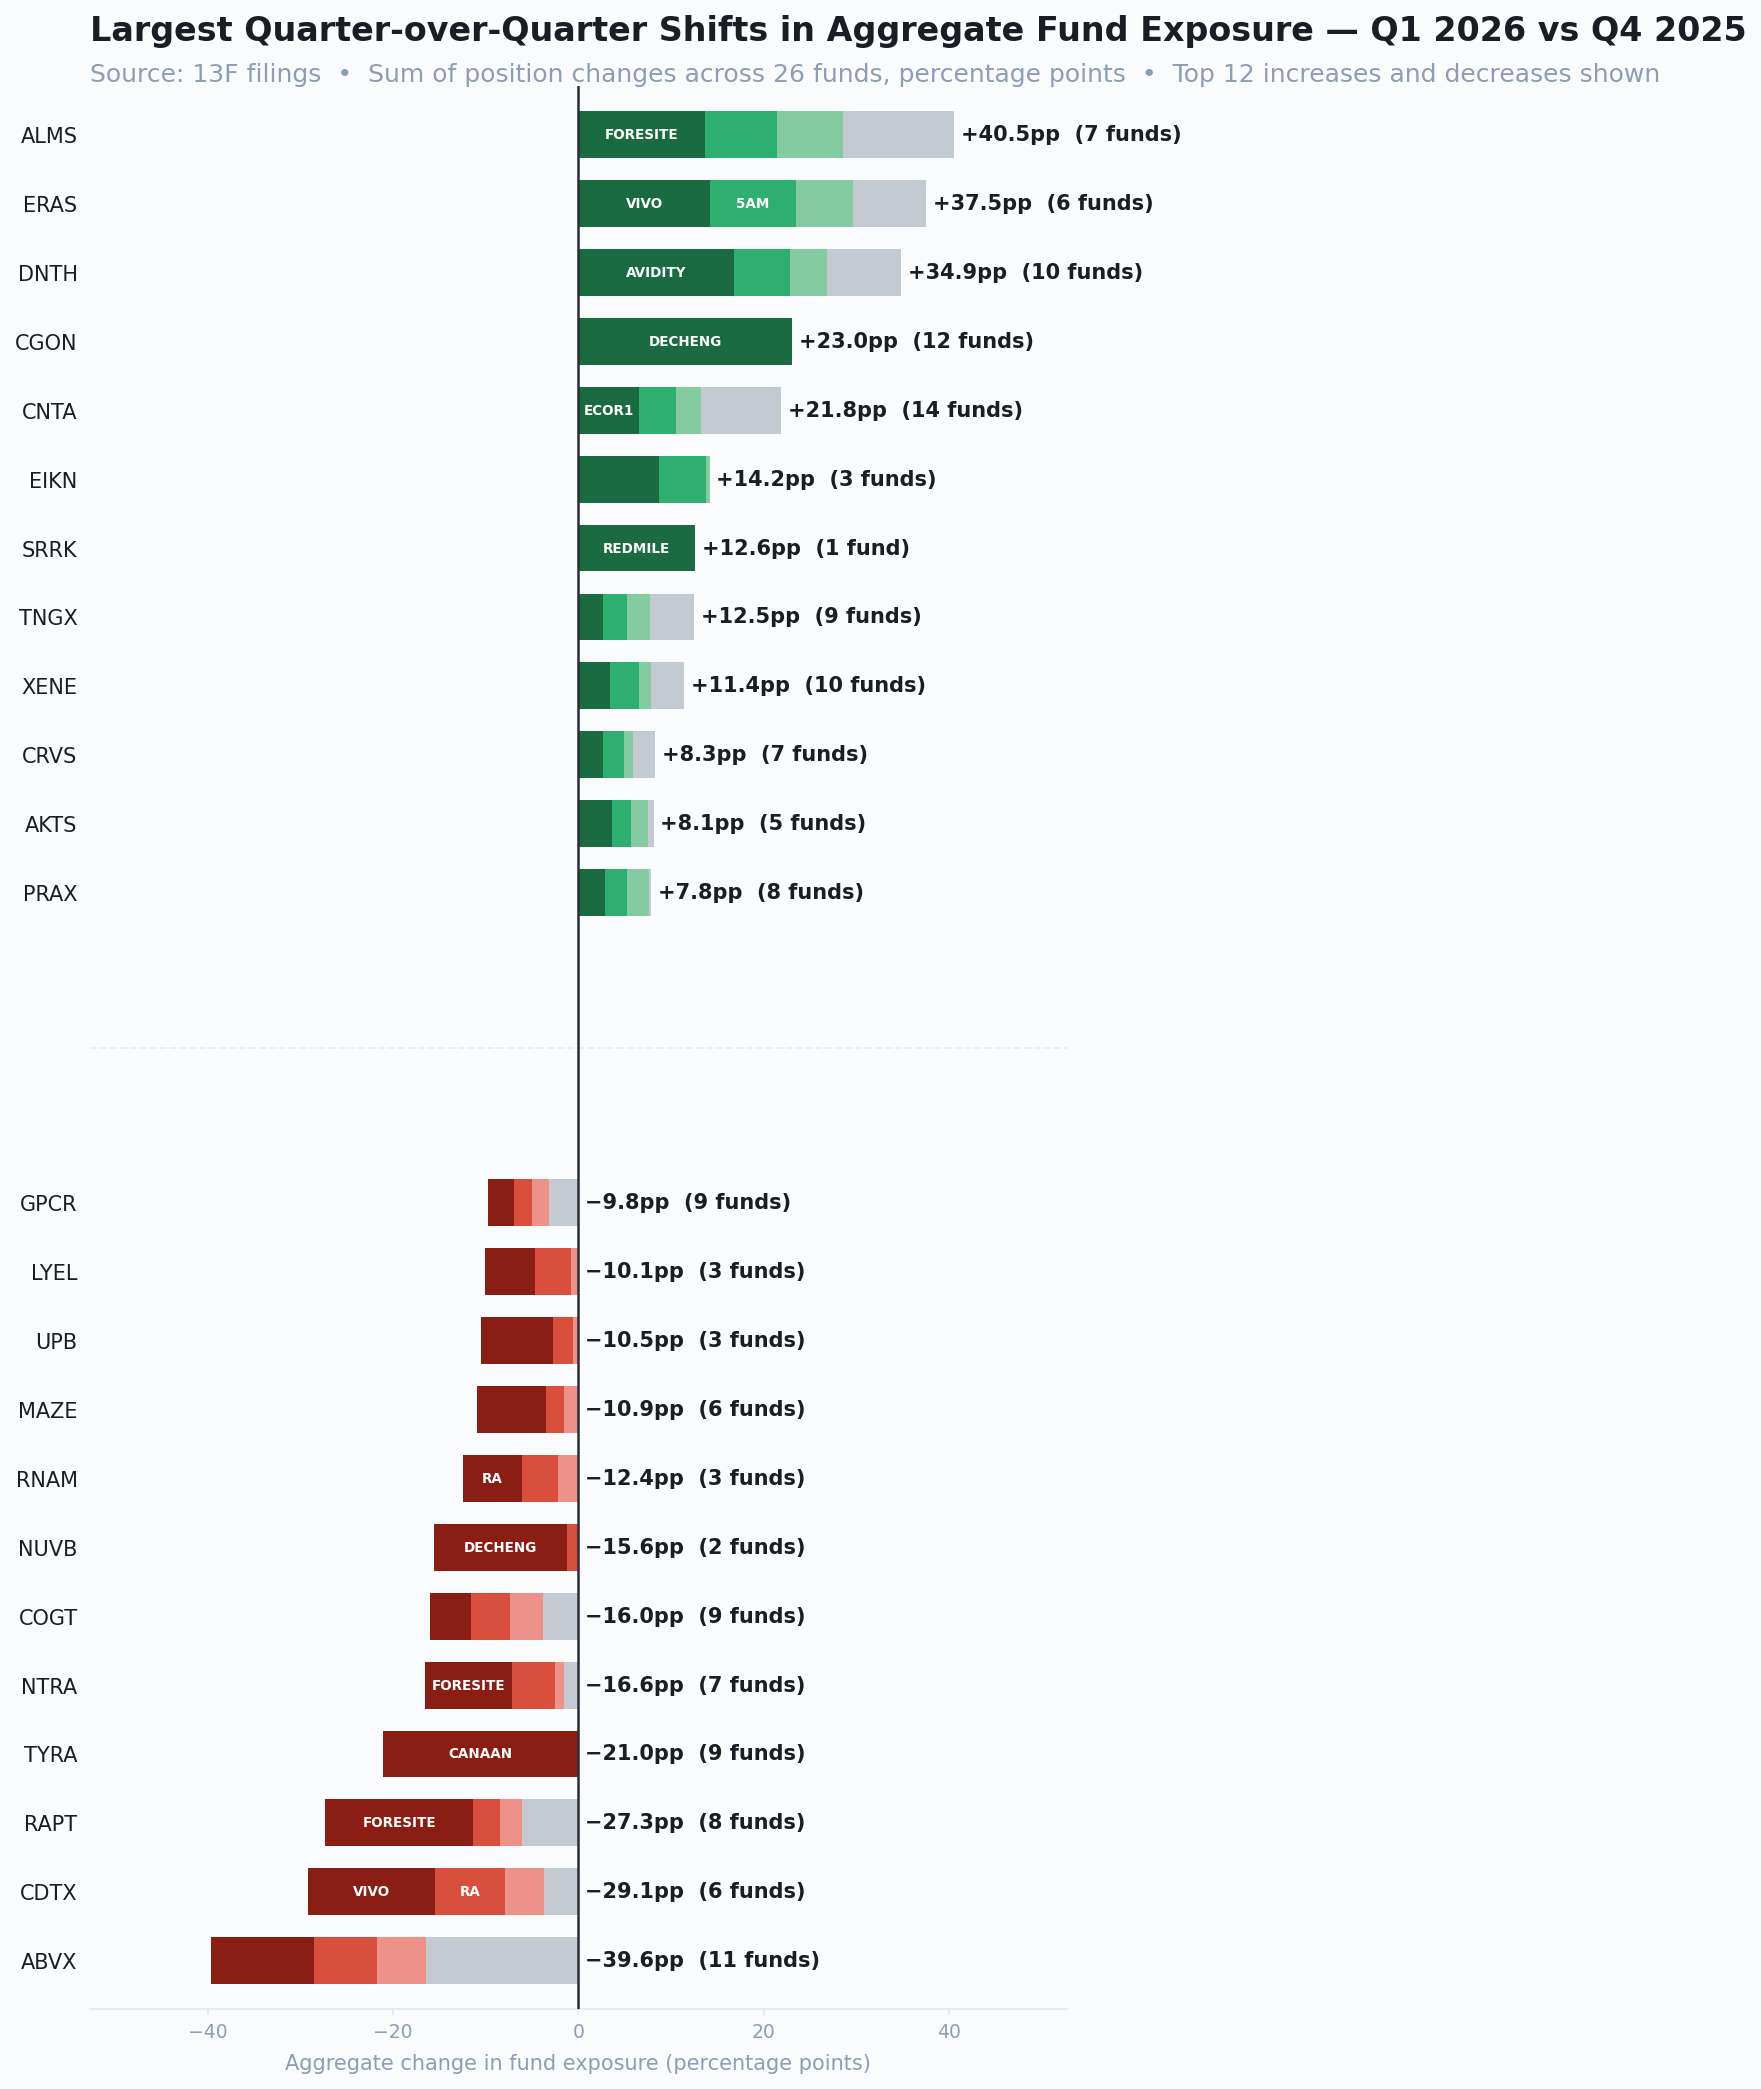
Sum of position changes across the 26 funds, in percentage points. Top twelve increases and decreases shown. Stacked color segments indicate contribution from individual funds.
On the buy side, the move splits along exactly that line. CNTA added the most breadth-driven exposure – +21.8% spread across 14 funds – which fits its place as the most widely held name in the universe (however, many funds have only nudged the same position slightly higher). On the other hand, ALMS has the single largest aggregate increase (+40.5% across 7 funds), but a large share of it comes from Foresite alone. SRRK also appears here at +12.6% from a single fund, which ties directly back to the conviction map (Redmile building a ~30% single-fund position from earlier).
On the side of reductions, ABVX is the largest aggregate reduction on the chart – a decrease of 39.6% across 11 funds – and it's also one of the five most widely held names and the reddest row on the signal map. It is held broadly and trimmed broadly, but not yet exited – many funds have decreased confidence in the company but have not completely abandoned it yet. Important to note that this action may be certain funds resizing their positions to allocate more capital to other investments, rather than a blatant reflection of a consensus losing faith. The data only reflects retreat but not the reason.
The next two largest reductions, RAPT and CDTX, are a different case entirely. Both were acquired and delisted during the quarter – RAPT by GSK, CDTX by Merck – so the funds holding them were cashed out rather than choosing to sell. Their positions show up as exits because the shares stopped existing, not because anyone lost conviction. It's a routine distinction in this kind of data, but one the chart itself can't make: a reduction can mean a position trimmed or a company bought.
InitiationsCoordinated new positions
The most forward-looking signal in a 13F is the coordinated new position — names where multiple funds opened a fresh holding in the same quarter. These are the bets being placed now, not the legacy conviction being maintained.
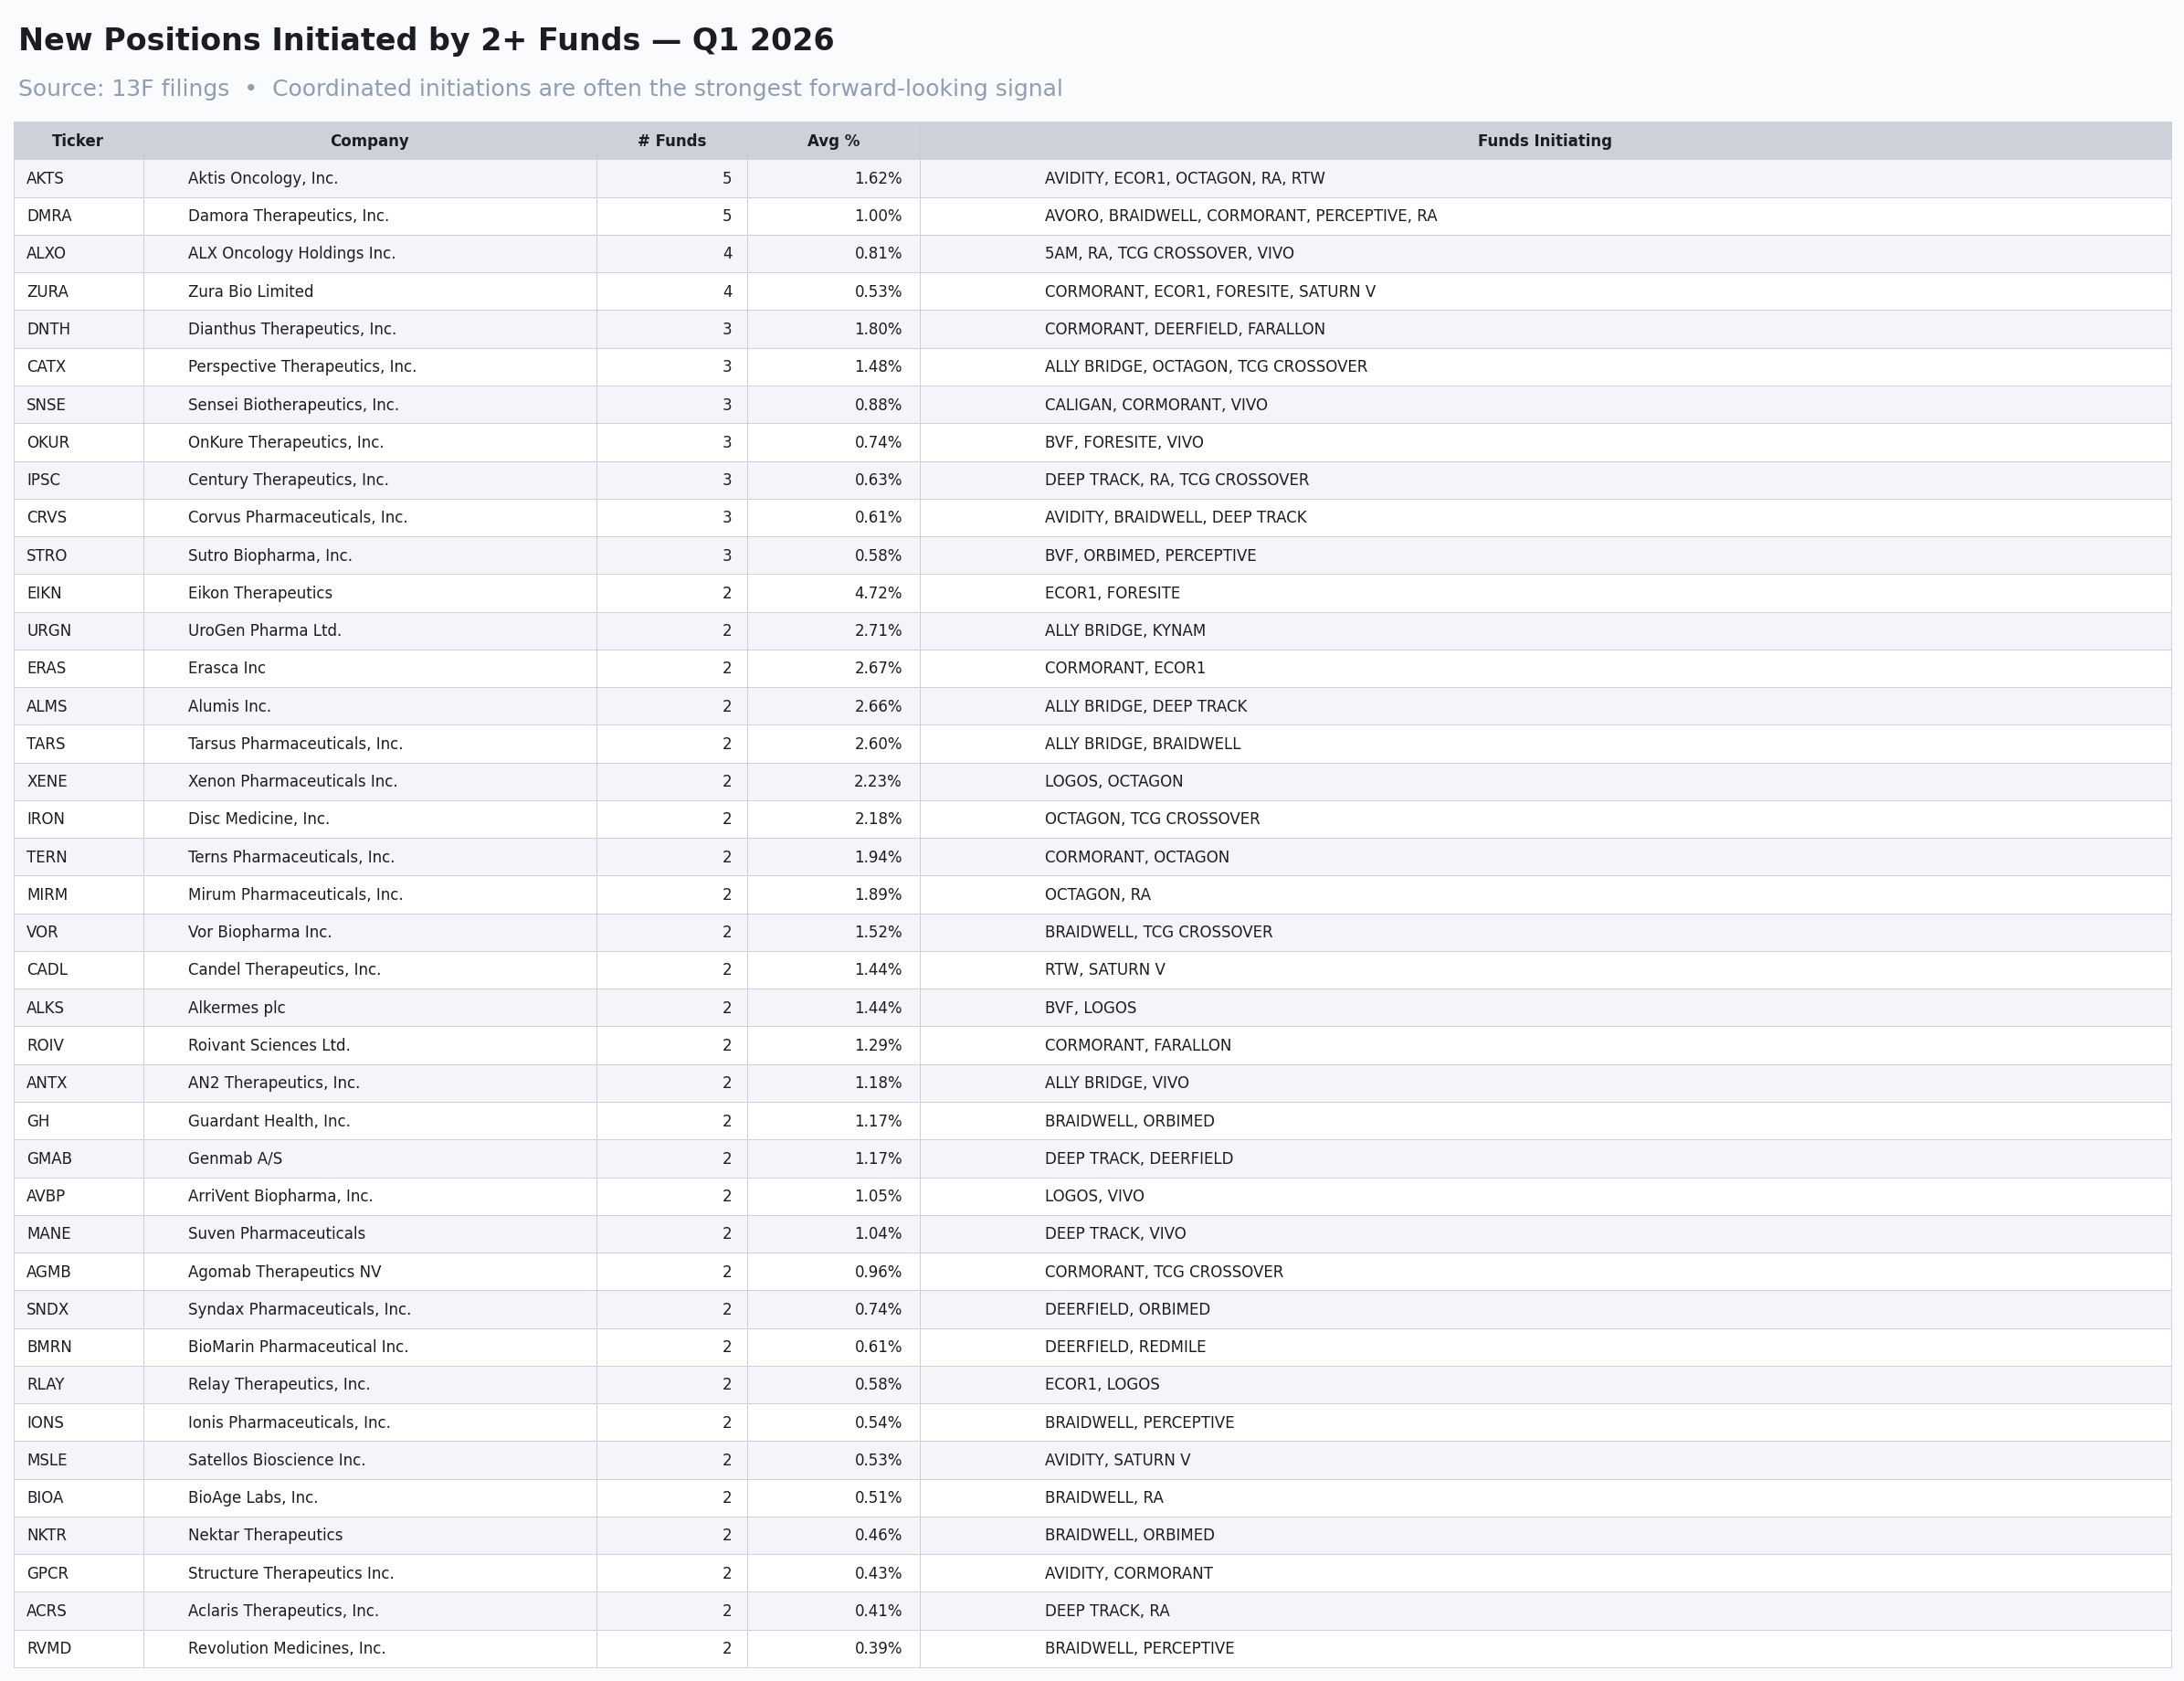
Names where two or more funds opened a new position in Q1 2026, ranked by number of initiating funds. Aktis Oncology and Damora Therapeutics lead at five funds each.
Aktis Oncology (AKTS) and Damora Therapeutics (DMRA) were each initiated by five funds — the strongest coordinated signal of the quarter. ALX Oncology (ALXO) and Zura Bio (ZURA) follow at four funds each. These are not yet crowded names, but they are names that several independent sets of analysts independently decided were worth a position in the same window. That's a different kind of signal than the legacy consensus longs.
ExitsNames every prior holder abandoned
The cleanest negative signal in the dataset: tickers where every fund that held the name in Q4 2025 had fully exited by Q1 2026. Not trimmed — exited.
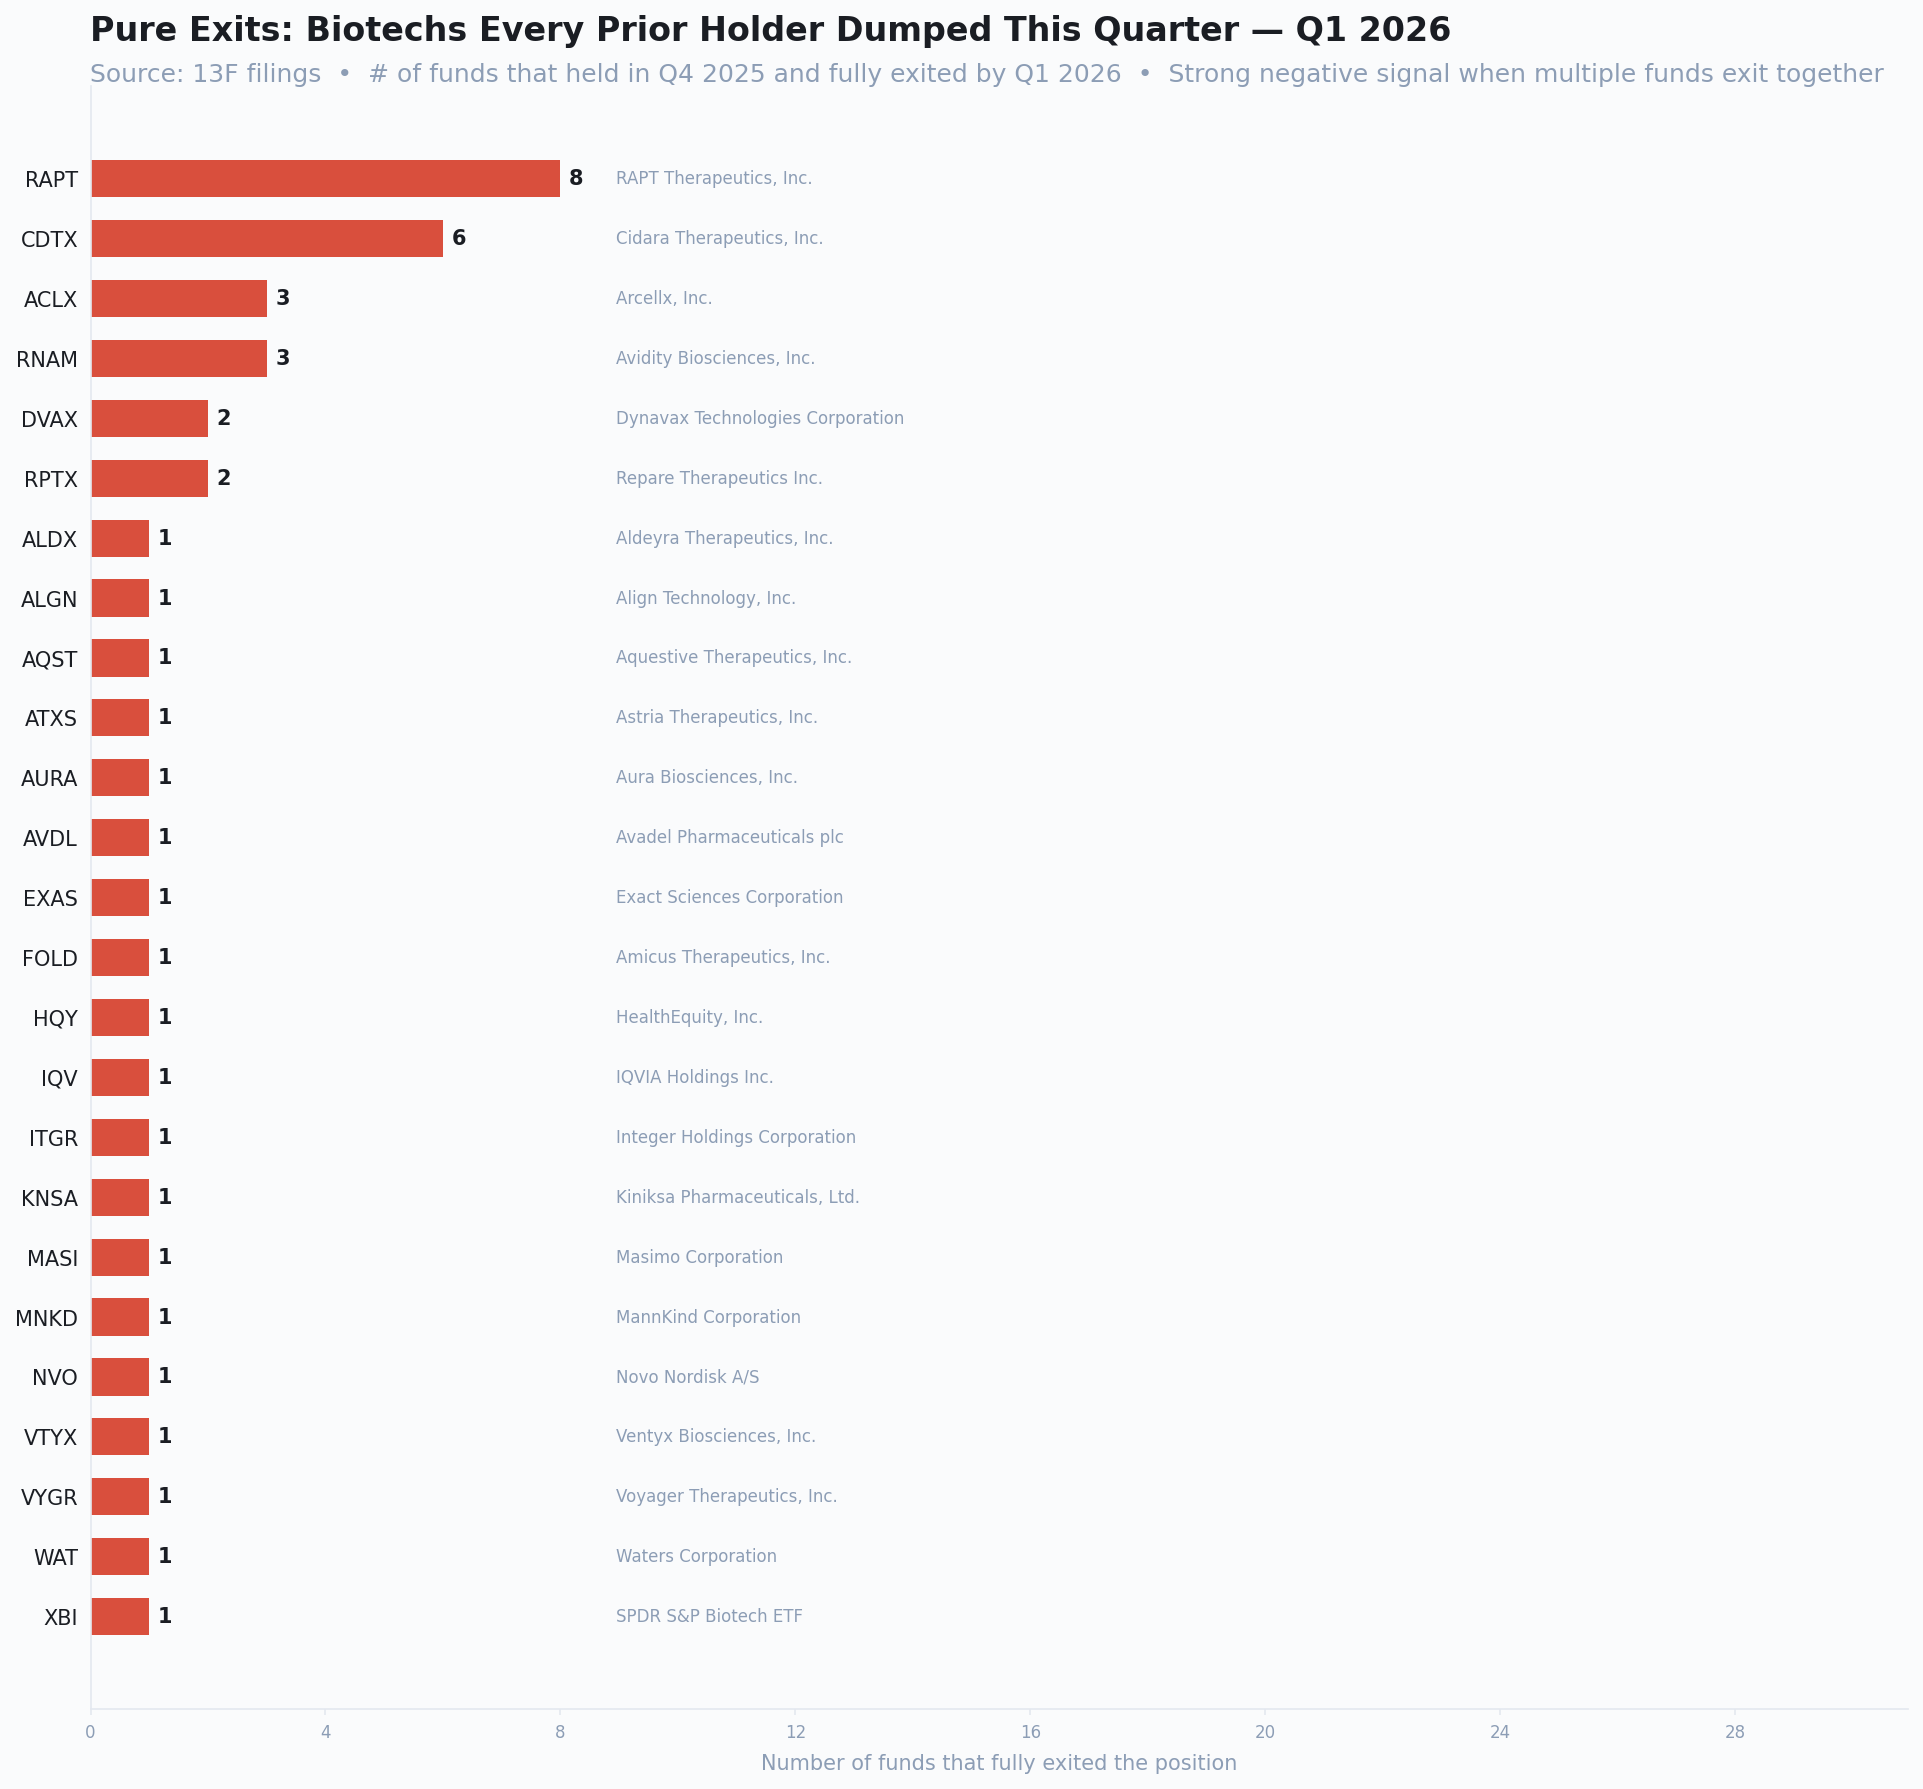
Number of funds that held the position in Q4 2025 and fully exited by Q1 2026. RAPT Therapeutics, abandoned by eight prior holders, leads the chart.
Eight funds held RAPT Therapeutics at the end of last quarter; zero hold it now. Six funds did the same with Cidara (CDTX). When the entire holder base of a name evacuates inside a single ninety-day window, the signal is harder to argue with than any single fund's decision in isolation.
SynthesisWhat this quarter actually shows
Three observations worth carrying forward. The consensus longs are mostly being supported, not distributed — the signal map's top rows are predominantly green, suggesting funds are still building into the names they collectively hold. Conviction is concentrated in very few names — most of the universe is held in watchlist-sized positions, with only CGON visibly occupying the crowded high-conviction quadrant. And the coordinated exits are louder than the coordinated entries — RAPT and CDTX leave their entire holder base in a single quarter, while the new-position cluster (AKTS, DMRA at five funds each) is meaningful but more modest in scale.
The descriptive read is that Q1 2026 looks like a quarter of selective reinforcement on existing winners, accompanied by surgical abandonment of names that have lost the room. The new-position cluster is the place to watch — coordinated initiations have historically been the strongest forward-looking signal in 13F data, and AKTS and DMRA are now the names with five independent analyst teams agreeing they're worth owning.
Tooling, methodology, and the analyst infrastructure that produced this brief are documented in the 13F Biotech Intelligence Tool writeup.
Methodology & Disclosures
Coverage universe: twenty-six biotech-focused hedge funds. Positions extracted from publicly filed 13F disclosures via WhaleWisdom and processed through the 13F Intelligence Tool. A policy filter restricts the dataset to healthcare-sector equities (excluding warrants, options, and convertibles) where the position represents at least 0.5% of portfolio or has changed by at least 0.25 percentage points quarter over quarter.
13F data is lagged by 45 days from quarter-end and reports long positions only. Short positions, derivative exposures, and intra-quarter trading are not visible. Positions reflect filings as of the reporting date; positions may have changed since.
This brief is for educational and informational purposes only. It is not investment advice and does not constitute a recommendation to buy, sell, or hold any security. The author is a student; analysis reflects pattern observation, not professional research.